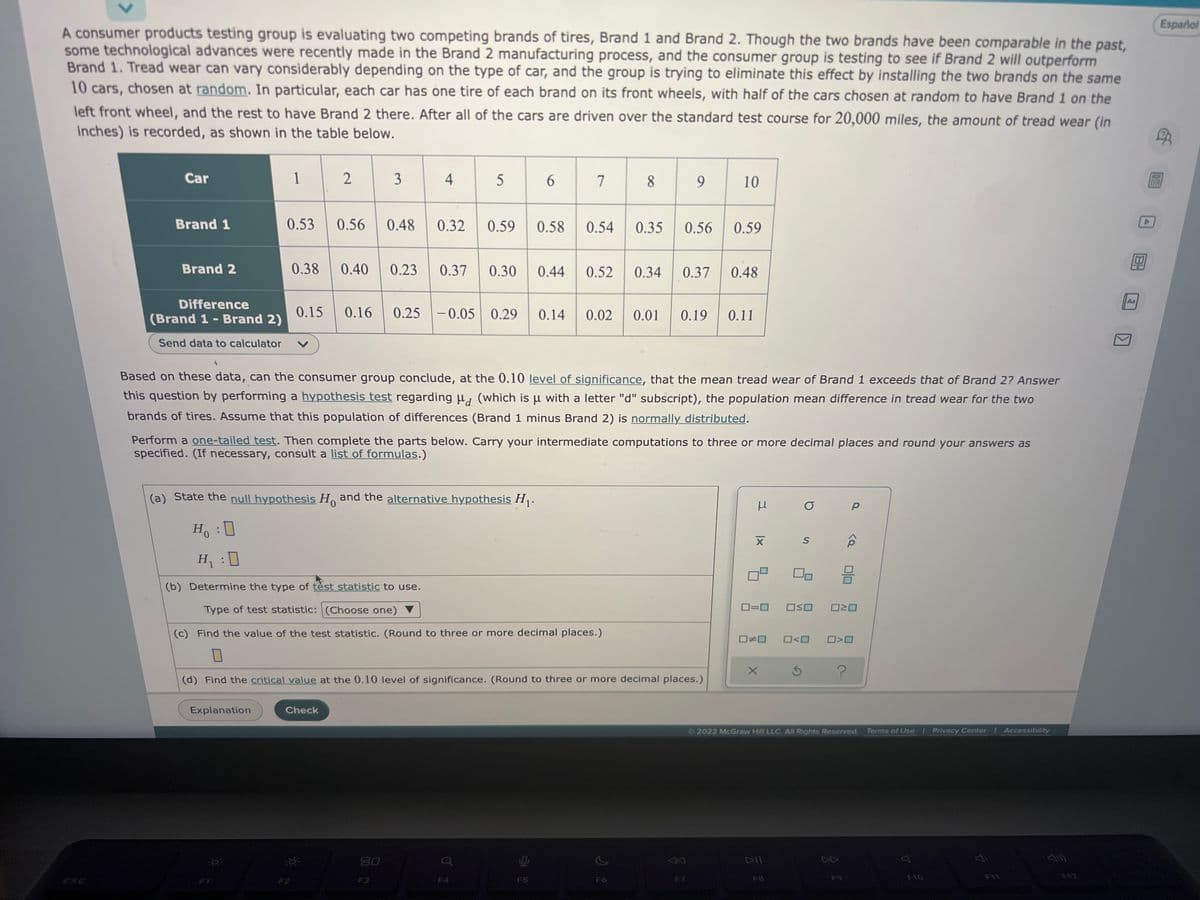
Esp A consumer products testing group is evaluating two competing brands of tires, Brand 1 and Brand 2. Though the two brands have been comparable in the past, some technological advances were recently made in the Brand 2 manufacturing process, and the consumer group is testing to see if Brand 2 will outperform Brand 1. Tread wear can vary considerably depending on the type of car, and the group is trying to eliminate this effect by installing the two brands on the same 10 cars, chosen at random. In particular, each car has one tire of each brand on its front wheels, with half of the cars chosen at random to have Brand 1 on the left front wheel, and the rest to have Brand 2 there. After all of the cars are driven over the standard test course for 20,000 miles, the amount of tread wear (in inches) is recorded, as shown in the table below. Car 1 2 3 4 5 6 7 89 10 D Brand 1 0.53 0.56 0.48 0.32 0.59 0.58 0.54 0.35 0.56 0.59 90 Brand 2 0.38 0.40 0.23 0.37 0.30 0.44 0.52 0.34 0.37 0.48 0.11 Difference (Brand 1- Brand 2) 0.15 0.16 0.25 -0.05 0.29 0.14 0.02 0.01 0.19 Send data to calculator Based on these data, can the consumer group conclude, at the 0.10 level of significance, that the mean tread wear of Brand 1 exceeds that of Brand 2? Answer this question by performing a hypothesis test regarding Hd (which is u with a letter "d" subscript), the population mean difference in tread wear for the two brands of tires. Assume that this population of differences (Brand 1 minus Brand 2) is normally distributed. Perform a one-tailed test. Then complete the parts below. Carry your intermediate computations to three or more decimal places and round your answers as specified. (If necessary, consult a list of formulas.) (a) State the null hypothesis Ho and the alternative hypothesis H₁. H O P Р X S ê Ho :D H₁ :0 (b) Determine the type of test statistic to use. 0-0 050 020 Type of test statistic: (Choose one) ▼ (c) Find the value of the test statistic. (Round to three or more decimal places.) DYD D
Esp A consumer products testing group is evaluating two competing brands of tires, Brand 1 and Brand 2. Though the two brands have been comparable in the past, some technological advances were recently made in the Brand 2 manufacturing process, and the consumer group is testing to see if Brand 2 will outperform Brand 1. Tread wear can vary considerably depending on the type of car, and the group is trying to eliminate this effect by installing the two brands on the same 10 cars, chosen at random. In particular, each car has one tire of each brand on its front wheels, with half of the cars chosen at random to have Brand 1 on the left front wheel, and the rest to have Brand 2 there. After all of the cars are driven over the standard test course for 20,000 miles, the amount of tread wear (in inches) is recorded, as shown in the table below. Car 1 2 3 4 5 6 7 89 10 D Brand 1 0.53 0.56 0.48 0.32 0.59 0.58 0.54 0.35 0.56 0.59 90 Brand 2 0.38 0.40 0.23 0.37 0.30 0.44 0.52 0.34 0.37 0.48 0.11 Difference (Brand 1- Brand 2) 0.15 0.16 0.25 -0.05 0.29 0.14 0.02 0.01 0.19 Send data to calculator Based on these data, can the consumer group conclude, at the 0.10 level of significance, that the mean tread wear of Brand 1 exceeds that of Brand 2? Answer this question by performing a hypothesis test regarding Hd (which is u with a letter "d" subscript), the population mean difference in tread wear for the two brands of tires. Assume that this population of differences (Brand 1 minus Brand 2) is normally distributed. Perform a one-tailed test. Then complete the parts below. Carry your intermediate computations to three or more decimal places and round your answers as specified. (If necessary, consult a list of formulas.) (a) State the null hypothesis Ho and the alternative hypothesis H₁. H O P Р X S ê Ho :D H₁ :0 (b) Determine the type of test statistic to use. 0-0 050 020 Type of test statistic: (Choose one) ▼ (c) Find the value of the test statistic. (Round to three or more decimal places.) DYD D

Linear Algebra: A Modern Introduction
4th Edition
ISBN:9781285463247
Author:David Poole
Publisher:David Poole
Chapter2: Systems Of Linear Equations
Section2.4: Applications
Problem 28EQ

Related questions
Question
Please show how it is solve
Transcribed Image Text:V
Español
A consumer products testing group is evaluating two competing brands of tires, Brand 1 and Brand 2. Though the two brands have been comparable in the past,
some technological advances were recently made in the Brand 2 manufacturing process, and the consumer group is testing to see if Brand 2 will outperform
Brand 1. Tread wear can vary considerably depending on the type of car, and the group is trying to eliminate this effect by installing the two brands on the same
10 cars, chosen at random. In particular, each car has one tire of each brand on its front wheels, with half of the cars chosen at random to have Brand 1 on the
left front wheel, and the rest to have Brand 2 there. After all of the cars are driven over the standard test course for 20,000 miles, the amount of tread wear (in
inches) is recorded, as shown in the table below.
Car
1
2
3
4
5
6
7
8
9
10
Brand 1
0.53 0.56
0.48
0.32 0.59 0.58
0.54 0.35 0.56 0.59
Brand 2
0.38 0.40
0.23 0.37
0.30 0.44 0.52 0.34
0.37 0.48
Aa
Difference
0.15 0.16 0.25 -0.05 0.29
0.14
0.02 0.01 0.19 0.11
(Brand 1- Brand 2)
Send data to calculator V
Based on these data, can the consumer group conclude, at the 0.10 level of significance, that the mean tread wear of Brand 1 exceeds that of Brand 2? Answer
this question by performing a hypothesis test regarding (which is μ with a letter "d" subscript), the population mean difference in tread wear for the two
brands of tires. Assume that this population of differences (Brand 1 minus Brand 2) is normally distributed.
Perform a one-tailed test. Then complete the parts below. Carry your intermediate computations to three or more decimal places and round your answers as
specified. (If necessary, consult a list of formulas.)
(a) State the null hypothesis Ho and the alternative hypothesis H₁.
μ
O
Р
S
Ho :D
H₁:0
00
(b) Determine the type of test statistic to use.
0=0 OSO
OND
Type of test statistic: (Choose one)
☐#0
<O ☐☐
(c) Find the value of the test statistic. (Round to three or more decimal places.)
0
3
?
(d) Find the critical value at the 0.10 level of significance. (Round to three or more decimal places.)
Explanation
Check
Ⓒ2022 McGraw Hill LLC. All Rights Reserved. Terms of Use | Privacy Center | Accessibility
4)))
0
DII
F10
F7
20
F3
J 2
XI
<Q
品
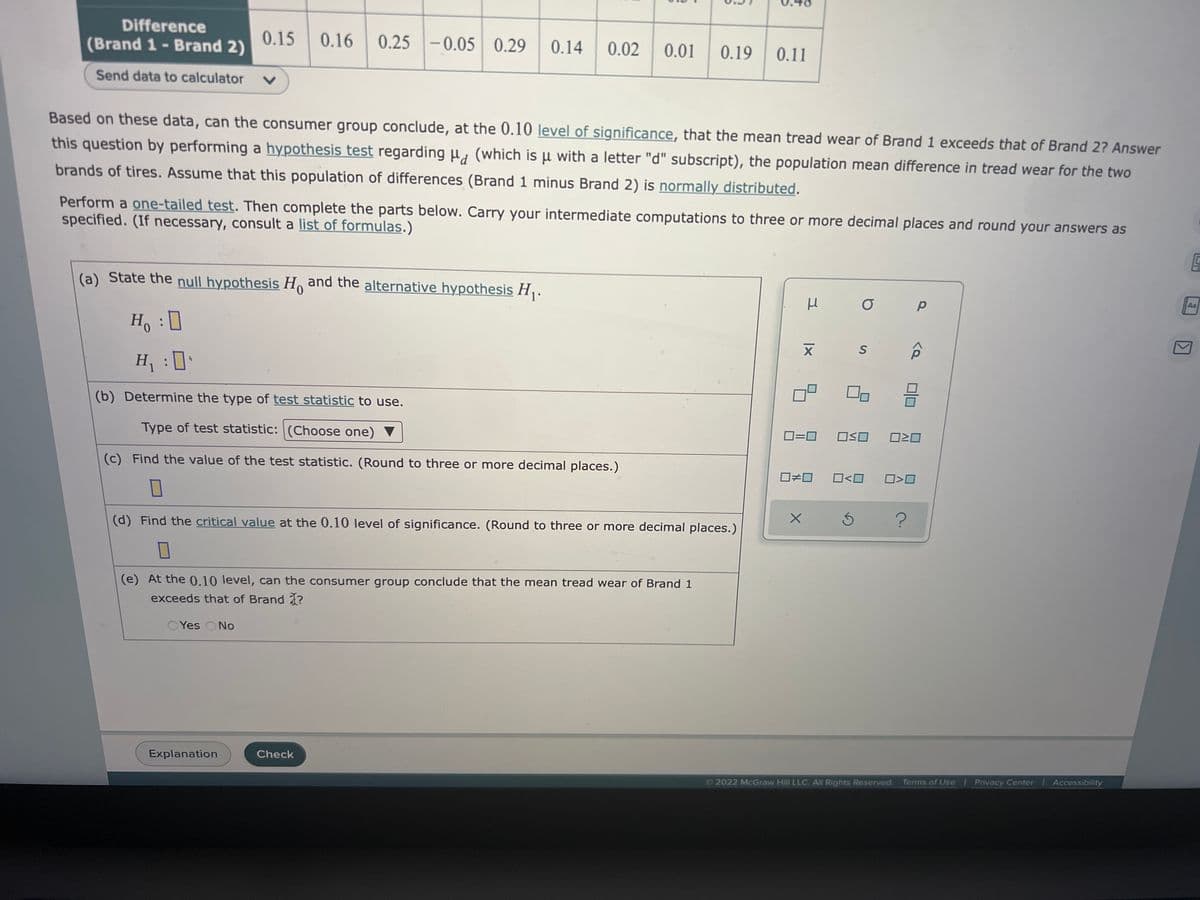
Transcribed Image Text:Difference
(Brand 1- Brand 2)
0.15 0.16 0.25 -0.05 0.29 0.14
0.02 0.01 0.19
0.11
Send data to calculator
V
Based on these data, can the consumer group conclude, at the 0.10 level of significance, that the mean tread wear of Brand 1 exceeds that of Brand 2? Answer
this question by performing a hypothesis test regarding (which is μ with a letter "d" subscript), the population mean difference in tread wear for the two
brands of tires. Assume that this population of differences (Brand 1 minus Brand 2) is normally distributed.
Perform a one-tailed test. Then complete the parts below. Carry your intermediate computations to three or more decimal places and round your answers as
specified. (If necessary, consult a list of formulas.)
(a) State the null hypothesis Ho and the alternative hypothesis H₁.
μ
O
Р
S
H₂ : D
H₁ :
0.
(b) Determine the type of test statistic to use.
Type of test statistic: (Choose one)
(c) Find the value of the test statistic. (Round to three or more decimal places.)
(d) Find the critical value at the 0.10 level of significance. (Round to three or more decimal places.)
(e) At the 0.10 level, can the consumer group conclude that the mean tread wear of Brand 1
exceeds that of Brand ?
Yes No
Check
Explanation
|x
<Q
믐
0=0 OSO 020
0#0 0<0 0>0
X
Ś
?
Ⓒ2022 McGraw Hill LLC. All Rights Reserved. Terms of Use | Privacy Center | Accessibility
Hal
Aa
Expert Solution
This question has been solved!
Explore an expertly crafted, step-by-step solution for a thorough understanding of key concepts.

This is a popular solution!

Trending now
This is a popular solution!

Step by step
Solved in 5 steps with 2 images

Recommended textbooks for you
Linear Algebra: A Modern Introduction
Algebra
ISBN:
9781285463247
Author:
David Poole
Publisher:
Cengage Learning

College Algebra (MindTap Course List)
Algebra
ISBN:
9781305652231
Author:
R. David Gustafson, Jeff Hughes
Publisher:
Cengage Learning
Linear Algebra: A Modern Introduction
Algebra
ISBN:
9781285463247
Author:
David Poole
Publisher:
Cengage Learning
College Algebra (MindTap Course List)
Algebra
ISBN:
9781305652231
Author:
R. David Gustafson, Jeff Hughes
Publisher:
Cengage Learning