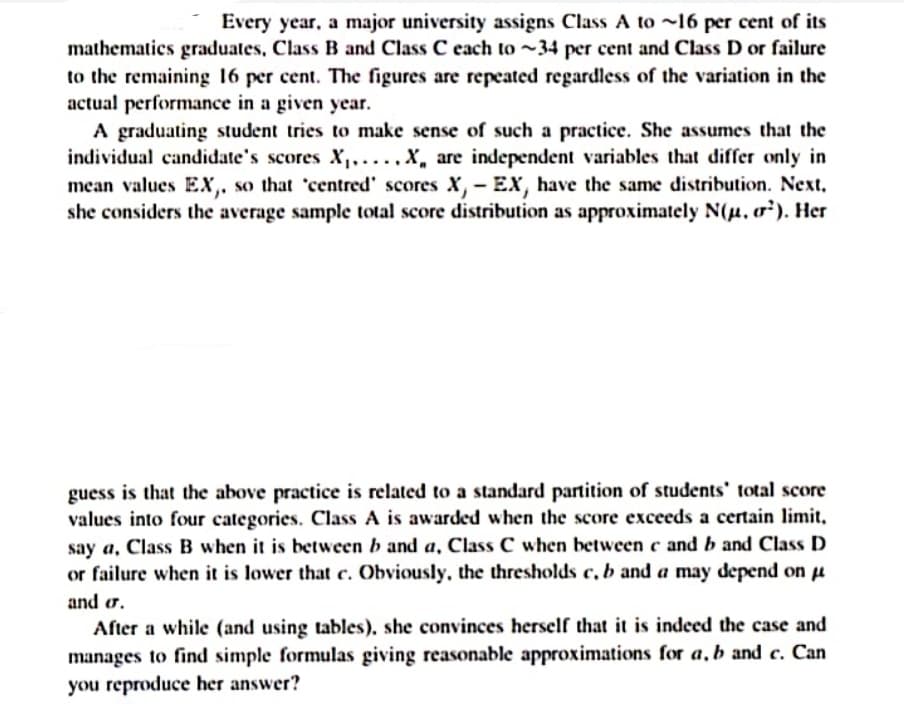
Every year, a major university assigns Class A to ~16 per cent of its mathematics graduates, Class B and Class C each to ~34 per cent and Class D or failure to the remaining 16 per cent. The figures are repeated regardless of the variation in the actual performance in a given year. A graduating student tries to make sense of such a practice. She assumes that the individual candidate's scores X,....x, are independent variables that differ only in mean values EX,, so that 'centred' scores X, - EX, have the same distribution. Next. she considers the average sample total score distribution as approximately N(u. o²). Her guess is that the above practice is related to a standard partition of students' total score values into four categories. Class A is awarded when the score exceeds a certain limit, say a, Class B when it is between b and a, Class C when between c and b and Class D or failure when it is lower that c. Obviously, the thresholds c, b and a may depend on u and o. After a while (and using tables), she convinces herself that it is indeed the case and manages to find simple formulas giving reasonable approximations for a, b and c. Can you reproduce her answer?
Every year, a major university assigns Class A to ~16 per cent of its mathematics graduates, Class B and Class C each to ~34 per cent and Class D or failure to the remaining 16 per cent. The figures are repeated regardless of the variation in the actual performance in a given year. A graduating student tries to make sense of such a practice. She assumes that the individual candidate's scores X,....x, are independent variables that differ only in mean values EX,, so that 'centred' scores X, - EX, have the same distribution. Next. she considers the average sample total score distribution as approximately N(u. o²). Her guess is that the above practice is related to a standard partition of students' total score values into four categories. Class A is awarded when the score exceeds a certain limit, say a, Class B when it is between b and a, Class C when between c and b and Class D or failure when it is lower that c. Obviously, the thresholds c, b and a may depend on u and o. After a while (and using tables), she convinces herself that it is indeed the case and manages to find simple formulas giving reasonable approximations for a, b and c. Can you reproduce her answer?

MATLAB: An Introduction with Applications
6th Edition
ISBN:9781119256830
Author:Amos Gilat
Publisher:Amos Gilat
Chapter1: Starting With Matlab
Section: Chapter Questions
Problem 1P

Related questions
Question
Transcribed Image Text:Every year, a major university assigns Class A to ~16 per cent of its
mathematics graduates, Class B and Class C each to ~34 per cent and Class D or failure
to the remaining 16 per cent. The figures are repeated regardless of the variation in the
actual performance in a given year.
A graduating student tries to make sense of such a practice. She assumes that the
individual candidate's scores X,....x, are independent variables that differ only in
mean values Ex,. so that 'centred' scores X, - EX, have the same distribution. Next.
she considers the average sample total score distribution as approximately N(u. o). Her
guess is that the above practice is related to a standard partition of students' total score
values into four categories. Class A is awarded when the score exceeds a certain limit,
say a, Class B when it is between b and a, Class C when between c and b and Class D
or failure when it is lower that c. Obviously, the thresholds c, b and a may depend on u
and or.
After a while (and using tables), she convinces herself that it is indeed the case and
manages to find simple formulas giving reasonable approximations for a, b and c. Can
you reproduce her answer?
Expert Solution
This question has been solved!
Explore an expertly crafted, step-by-step solution for a thorough understanding of key concepts.

Step by step
Solved in 3 steps

Recommended textbooks for you
MATLAB: An Introduction with Applications
Statistics
ISBN:
9781119256830
Author:
Amos Gilat
Publisher:
John Wiley & Sons Inc

Probability and Statistics for Engineering and th…
Statistics
ISBN:
9781305251809
Author:
Jay L. Devore
Publisher:
Cengage Learning

Statistics for The Behavioral Sciences (MindTap C…
Statistics
ISBN:
9781305504912
Author:
Frederick J Gravetter, Larry B. Wallnau
Publisher:
Cengage Learning
MATLAB: An Introduction with Applications
Statistics
ISBN:
9781119256830
Author:
Amos Gilat
Publisher:
John Wiley & Sons Inc
Probability and Statistics for Engineering and th…
Statistics
ISBN:
9781305251809
Author:
Jay L. Devore
Publisher:
Cengage Learning
Statistics for The Behavioral Sciences (MindTap C…
Statistics
ISBN:
9781305504912
Author:
Frederick J Gravetter, Larry B. Wallnau
Publisher:
Cengage Learning

Elementary Statistics: Picturing the World (7th E…
Statistics
ISBN:
9780134683416
Author:
Ron Larson, Betsy Farber
Publisher:
PEARSON

The Basic Practice of Statistics
Statistics
ISBN:
9781319042578
Author:
David S. Moore, William I. Notz, Michael A. Fligner
Publisher:
W. H. Freeman

Introduction to the Practice of Statistics
Statistics
ISBN:
9781319013387
Author:
David S. Moore, George P. McCabe, Bruce A. Craig
Publisher:
W. H. Freeman