The following figure is a probability density curve that represents the grade point averages (GPA) of the graduating seniors at a large university. Area = 0.65 Area = 0.22 3.9 4.3 4.7 5.1 5.5
The following figure is a probability density curve that represents the grade point averages (GPA) of the graduating seniors at a large university. Area = 0.65 Area = 0.22 3.9 4.3 4.7 5.1 5.5

Glencoe Algebra 1, Student Edition, 9780079039897, 0079039898, 2018
18th Edition
ISBN:9780079039897
Author:Carter
Publisher:Carter
Chapter10: Statistics
Section10.1: Measures Of Center
Problem 9PPS

Related questions
Question
The following figure is a probability density curve that represents the grade point averages (GPA) of the graduating seniors at a
large university.
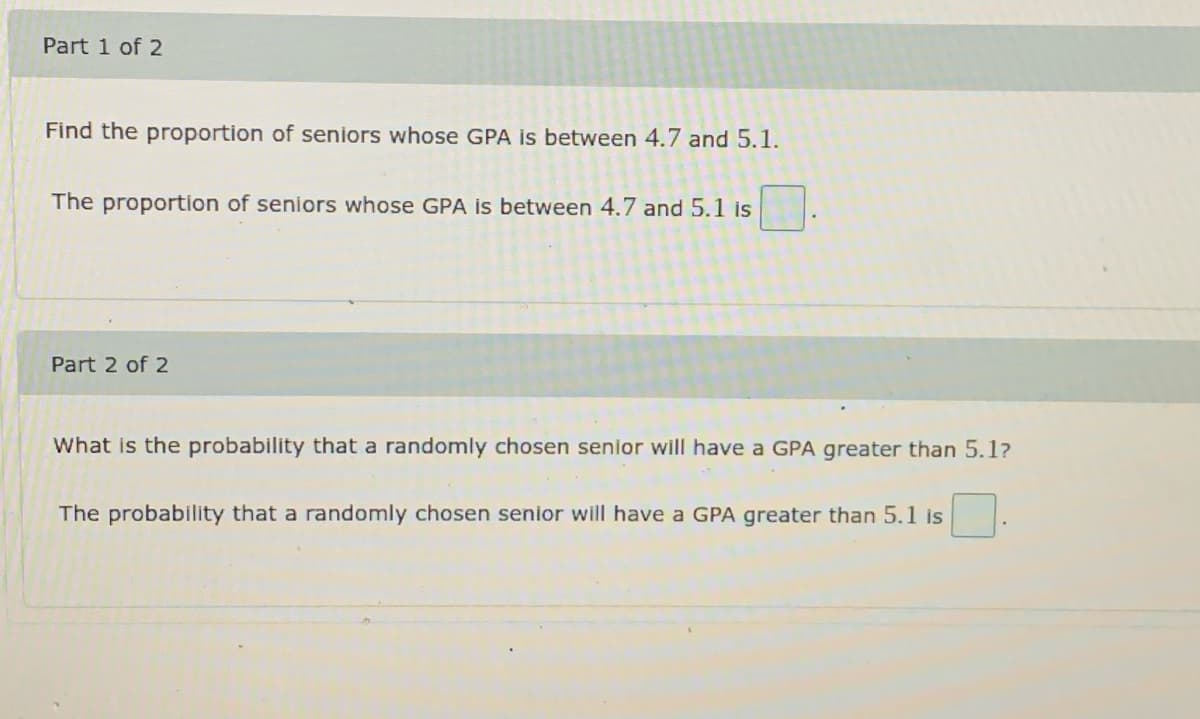
Transcribed Image Text:Part 1 of 2
Find the proportion of seniors whose GPA is between 4.7 and 5.1.
The proportion of seniors whose GPA is between 4.7 and 5.1 is
Part 2 of 2
What is the probability that a randomly chosen senior will have a GPA greater than 5.1?
The probability that a randomly chosen senior will have a GPA greater than 5.1 is
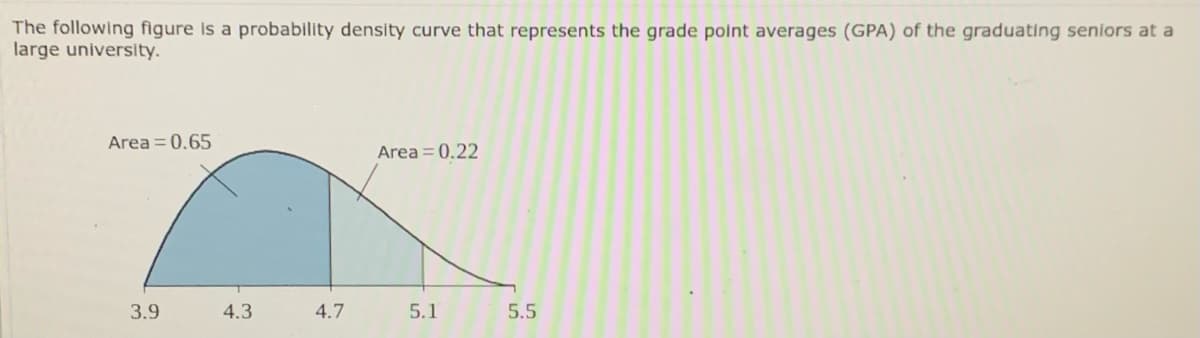
Transcribed Image Text:The following figure is a probability density curve that represents the grade point averages (GPA) of the graduating seniors at a
large university.
Area = 0.65
Area = 0.22
3.9
4.3
4.7
5.1
5.5
Expert Solution
This question has been solved!
Explore an expertly crafted, step-by-step solution for a thorough understanding of key concepts.

This is a popular solution!

Trending now
This is a popular solution!

Step by step
Solved in 2 steps with 1 images

Recommended textbooks for you
Glencoe Algebra 1, Student Edition, 9780079039897…
Algebra
ISBN:
9780079039897
Author:
Carter
Publisher:
McGraw Hill
Glencoe Algebra 1, Student Edition, 9780079039897…
Algebra
ISBN:
9780079039897
Author:
Carter
Publisher:
McGraw Hill