Every year, all incoming high school freshmen in a large school district take a math placement test. For this year's test, the district has prepared two possi versions: Version 1 that covers more material than last year's test and Version 2 test that is similar to last year's test. The district suspects that the mean for Version 1 will be less than the mean score for Version 2. To examine this, over the summer the district randomly selects 90 incoming freshmen to come offices to take Version 1, and it randomly selects 80 incoming freshmen to come take Version 2. The 90 incoming freshmen taking Version 1 score a mean 112.7 points with a standard deviation of 14.1. The 80 incoming freshmen taking Version 2 score a mean of 117.3 points with a standard deviation of 15.5. Assume that the population standard deviations of the test scores from the two versions can be estimated to be the sample standard deviations, since the samples that are used to compute them are quite large. At the 0.05 level of significance, is there enough evidence to support the claim that the mean test score, ₁, for Version 1 is less than the mean test score, μ₂, for Version 2? Perform a one-tailed test. Then complete the parts below. Carry your intermediate computations to at least three decimal places. (If necessary, consult a list of formulas.) (a) State the null hypothesis Ho and the alternative hypothesis H₁. μ O P S Ho :O H₁ :0 (b) Determine the type of test statistic to use. OSO (Choose one) Go to Set Submit Assi Continue © 2022 McGraw Hill LLC. All Rights Reserved. Terms of Use | Privacy Center 1 Act 59°F Cloudy X 4 2 ê
Every year, all incoming high school freshmen in a large school district take a math placement test. For this year's test, the district has prepared two possi versions: Version 1 that covers more material than last year's test and Version 2 test that is similar to last year's test. The district suspects that the mean for Version 1 will be less than the mean score for Version 2. To examine this, over the summer the district randomly selects 90 incoming freshmen to come offices to take Version 1, and it randomly selects 80 incoming freshmen to come take Version 2. The 90 incoming freshmen taking Version 1 score a mean 112.7 points with a standard deviation of 14.1. The 80 incoming freshmen taking Version 2 score a mean of 117.3 points with a standard deviation of 15.5. Assume that the population standard deviations of the test scores from the two versions can be estimated to be the sample standard deviations, since the samples that are used to compute them are quite large. At the 0.05 level of significance, is there enough evidence to support the claim that the mean test score, ₁, for Version 1 is less than the mean test score, μ₂, for Version 2? Perform a one-tailed test. Then complete the parts below. Carry your intermediate computations to at least three decimal places. (If necessary, consult a list of formulas.) (a) State the null hypothesis Ho and the alternative hypothesis H₁. μ O P S Ho :O H₁ :0 (b) Determine the type of test statistic to use. OSO (Choose one) Go to Set Submit Assi Continue © 2022 McGraw Hill LLC. All Rights Reserved. Terms of Use | Privacy Center 1 Act 59°F Cloudy X 4 2 ê

Glencoe Algebra 1, Student Edition, 9780079039897, 0079039898, 2018
18th Edition
ISBN:9780079039897
Author:Carter
Publisher:Carter
Chapter10: Statistics
Section10.5: Comparing Sets Of Data
Problem 3BGP

Related questions
Question
Transcribed Image Text:esc
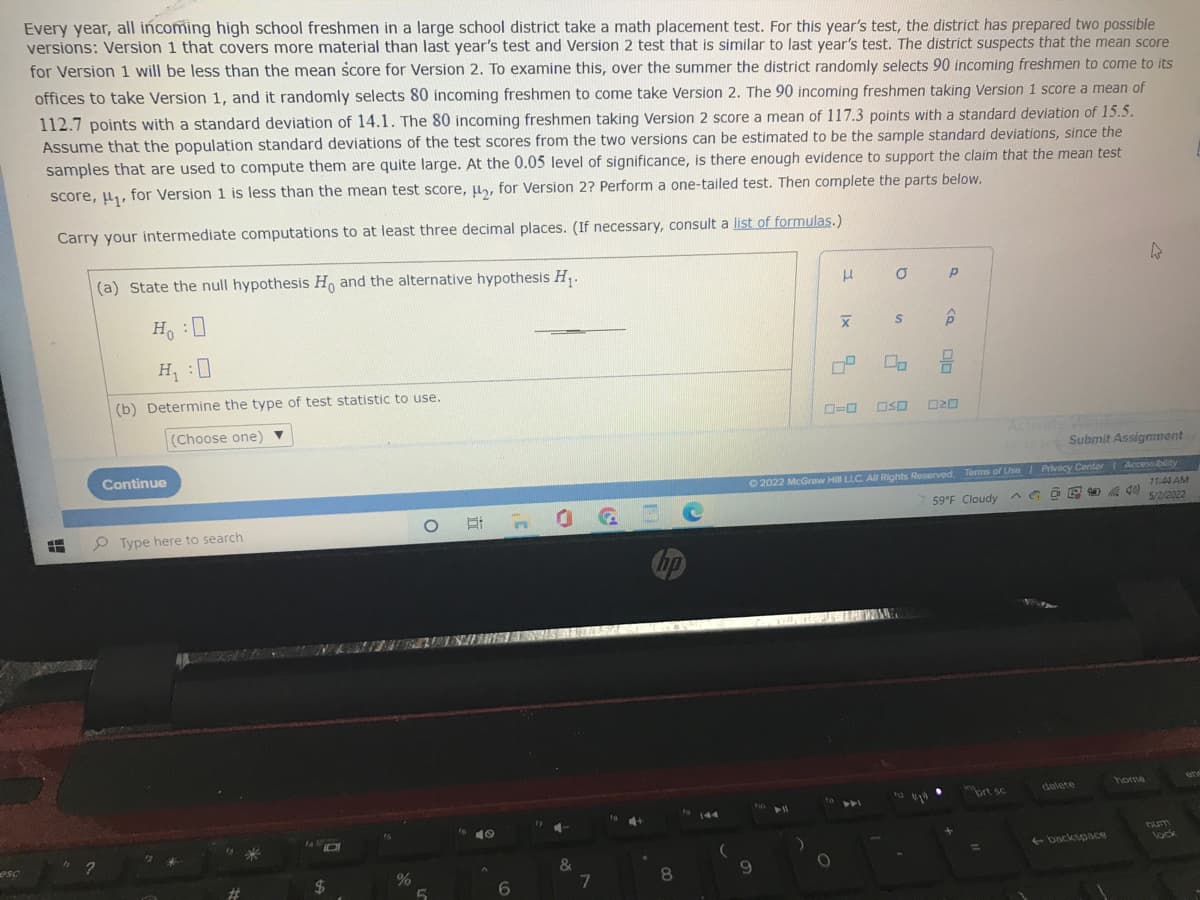
Every year, all incoming high school freshmen in a large school district take a math placement test. For this year's test, the district has prepared two possible
versions: Version 1 that covers more material than last year's test and Version 2 test that is similar to last year's test. The district suspects that the mean score
for Version 1 will be less than the mean score for Version 2. To examine this, over the summer the district randomly selects 90 incoming freshmen to come to its
offices to take Version 1, and it randomly selects 80 incoming freshmen to come take Version 2. The 90 incoming freshmen taking Version 1 score a mean of
112.7 points with a standard deviation of 14.1. The 80 incoming freshmen taking Version 2 score a mean of 117.3 points with a standard deviation of 15.5.
Assume that the population standard deviations of the test scores from the two versions can be estimated to be the sample standard deviations, since the
samples that are used to compute them are quite large. At the 0.05 level of significance, is there enough evidence to support the claim that the mean test
score, ₁, for Version 1 is less than the mean test score, μ₂, for Version 2? Perform a one-tailed test. Then complete the parts below.
Carry your intermediate computations to at least three decimal places. (If necessary, consult a list of formulas.)
(a) State the null hypothesis Ho and the alternative hypothesis H₁.
4
μ σ p
S
X
H₁:0
H₁:0
6
(b) Determine the type of test statistic to use.
(Choose one)
Go to Ser Submit Assignment
Continue
Accessibility
11:44 AM
40)
5/2/2022
ety
F
?
Type here to search
14
$
%
5
6
17 4.
&
7
hp
8
3
0-0 050 020
© 2022 McGraw Hill LLC. All Rights Reserved. Terms of Use | Privacy Center
59°F Cloudy Go
8
112
prt sc
delete
←backspace
9
510
0° 0
)
O
num
lock
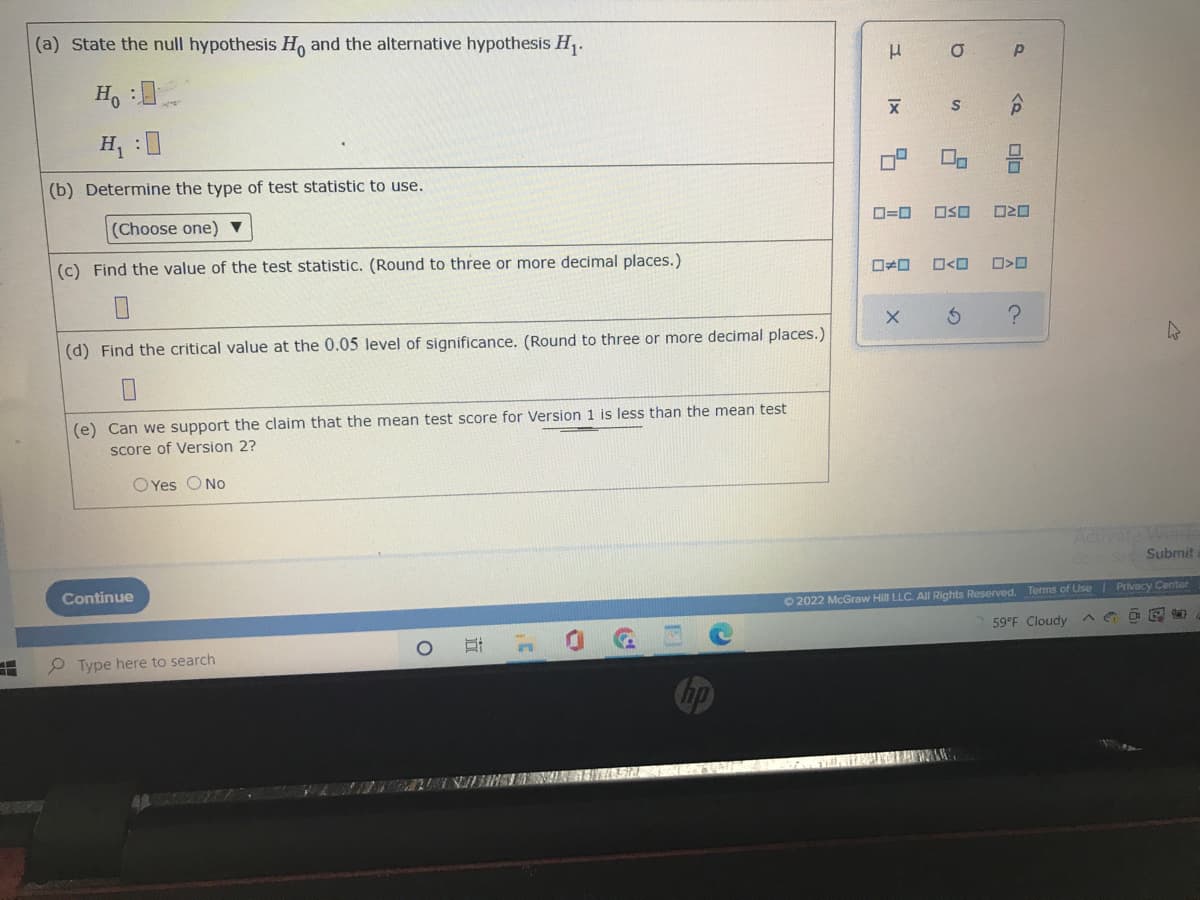
Transcribed Image Text:(a) State the null hypothesis Ho and the alternative hypothesis H₁.
Ho :
H₁ :0
(b) Determine the type of test statistic to use.
(Choose one) ▼
(c) Find the value of the test statistic. (Round to three or more decimal places.)
(d) Find the critical value at the 0.05 level of significance. (Round to three or more decimal places.)
(e) Can we support the claim that the mean test score for Version 1 is less than the mean test
score of Version 2?
OYes O No
Continue
Type here to search
O
3¹
F
no
μ σ
X
S
00
ロ=ロ OSO
X
W
Activate Winde
Go to Set Submit
Privacy Center
© 2022 McGraw Hill LLC. All Rights Reserved. Terms of Use
59°F Cloudy
CO
C
|x
<D
P
S
<Q
2010
>D
?
Expert Solution
This question has been solved!
Explore an expertly crafted, step-by-step solution for a thorough understanding of key concepts.

This is a popular solution!

Trending now
This is a popular solution!

Step by step
Solved in 2 steps with 2 images

Recommended textbooks for you
Glencoe Algebra 1, Student Edition, 9780079039897…
Algebra
ISBN:
9780079039897
Author:
Carter
Publisher:
McGraw Hill


Holt Mcdougal Larson Pre-algebra: Student Edition…
Algebra
ISBN:
9780547587776
Author:
HOLT MCDOUGAL
Publisher:
HOLT MCDOUGAL
Glencoe Algebra 1, Student Edition, 9780079039897…
Algebra
ISBN:
9780079039897
Author:
Carter
Publisher:
McGraw Hill
Holt Mcdougal Larson Pre-algebra: Student Edition…
Algebra
ISBN:
9780547587776
Author:
HOLT MCDOUGAL
Publisher:
HOLT MCDOUGAL