Every year, the students at a school are given a musical aptitude test that rates them from 0 (no musical aptitude) to 5 (high musical aptitude). This year's results were: Aptitude Score Frequency 1 3 2 1 3 4 4 The mean () aptitude score: (Please show your answer to 1 decimal place.) The median aptitude score: The mode aptitude score: (Please separate your answers by ',' in bimodal situation, Enter DNE if there is no mode.)
Every year, the students at a school are given a musical aptitude test that rates them from 0 (no musical aptitude) to 5 (high musical aptitude). This year's results were: Aptitude Score Frequency 1 3 2 1 3 4 4 The mean () aptitude score: (Please show your answer to 1 decimal place.) The median aptitude score: The mode aptitude score: (Please separate your answers by ',' in bimodal situation, Enter DNE if there is no mode.)

MATLAB: An Introduction with Applications
6th Edition
ISBN:9781119256830
Author:Amos Gilat
Publisher:Amos Gilat
Chapter1: Starting With Matlab
Section: Chapter Questions
Problem 1P

Related questions

Topic Video
Question

Transcribed Image Text:Every year, the students at a school are given a musical aptitude test that rates them from 0 (no musical
aptitude) to 5 (high musical aptitude). This year's results were:
Aptitude Score
Frequency
1
3
1
3
4
4
2
5
The mean (x) aptitude score:
(Please show your answer to 1 decimal place.)
The median aptitude score:
The mode aptitude score:
(Please separate your answers by ',' in bimodal
situation. Enter DNE if there is no mode.)
Expert Solution
Step 1
Introduction:
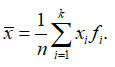
For a random variable X having k values, the ith observation of which is xi and frequency is fi, such that the total number of observations is n = Σ fi, the sample mean is as follows:
The median is the middle-most observation in the data set. In this case, as this is a frequency data, the median is the smallest value of x for which, the cumulative frequency exceeds n/2.
The mode is the most frequently-occurring observation in the data set.

Trending now
This is a popular solution!

Step by step
Solved in 4 steps with 4 images

Knowledge Booster


Learn more about
Need a deep-dive on the concept behind this application? Look no further. Learn more about this topic, statistics and related others by exploring similar questions and additional content below.Recommended textbooks for you
MATLAB: An Introduction with Applications
Statistics
ISBN:
9781119256830
Author:
Amos Gilat
Publisher:
John Wiley & Sons Inc

Probability and Statistics for Engineering and th…
Statistics
ISBN:
9781305251809
Author:
Jay L. Devore
Publisher:
Cengage Learning

Statistics for The Behavioral Sciences (MindTap C…
Statistics
ISBN:
9781305504912
Author:
Frederick J Gravetter, Larry B. Wallnau
Publisher:
Cengage Learning
MATLAB: An Introduction with Applications
Statistics
ISBN:
9781119256830
Author:
Amos Gilat
Publisher:
John Wiley & Sons Inc
Probability and Statistics for Engineering and th…
Statistics
ISBN:
9781305251809
Author:
Jay L. Devore
Publisher:
Cengage Learning
Statistics for The Behavioral Sciences (MindTap C…
Statistics
ISBN:
9781305504912
Author:
Frederick J Gravetter, Larry B. Wallnau
Publisher:
Cengage Learning

Elementary Statistics: Picturing the World (7th E…
Statistics
ISBN:
9780134683416
Author:
Ron Larson, Betsy Farber
Publisher:
PEARSON

The Basic Practice of Statistics
Statistics
ISBN:
9781319042578
Author:
David S. Moore, William I. Notz, Michael A. Fligner
Publisher:
W. H. Freeman

Introduction to the Practice of Statistics
Statistics
ISBN:
9781319013387
Author:
David S. Moore, George P. McCabe, Bruce A. Craig
Publisher:
W. H. Freeman