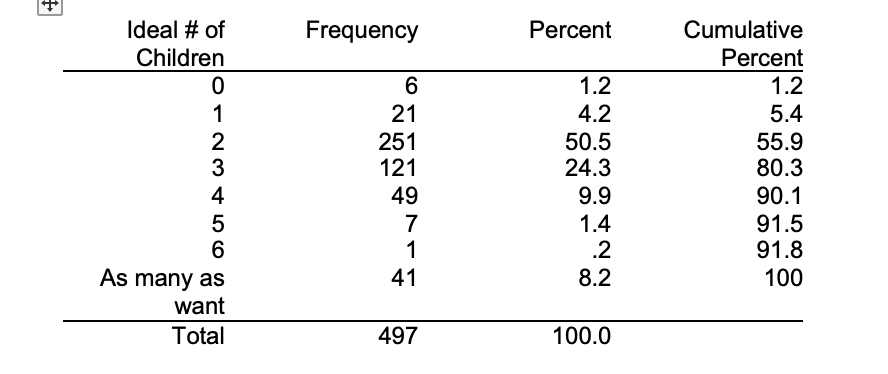
Examine the frequency distribution pasted below for the variable "Ideal Number of Children," taken from the 2002 GSS data. a. What percentage of respondents reported that their ideal was to have exactly 4 children? b. What percentage of respondents reported that their ideal was having 3 children or less? c. What is the median value for the variable “ideal number of children”?
Examine the frequency distribution pasted below for the variable "Ideal Number of Children," taken from the 2002 GSS data. a. What percentage of respondents reported that their ideal was to have exactly 4 children? b. What percentage of respondents reported that their ideal was having 3 children or less? c. What is the median value for the variable “ideal number of children”?

Algebra & Trigonometry with Analytic Geometry
13th Edition
ISBN:9781133382119
Author:Swokowski
Publisher:Swokowski
Chapter10: Sequences, Series, And Probability
Section10.2: Arithmetic Sequences
Problem 68E

Related questions
Question
- Examine the frequency distribution pasted below for the variable "Ideal Number of Children," taken from the 2002 GSS data. a. What percentage of respondents reported that their ideal was to have exactly 4 children?
b. What percentage of respondents reported that their ideal was having 3 children or less?
c. What is the median value for the variable “ideal number of children”?
Transcribed Image Text:Ideal # of
Frequency
Percent
Cumulative
Children
Percent
1.2
6
1.2
1
21
4.2
5.4
2
3
251
121
50.5
24.3
55.9
80.3
4
49
9.9
90.1
1.4
.2
91.5
91.8
7
1
41
8.2
100
As many as
want
Total
497
100.0
Expert Solution
This question has been solved!
Explore an expertly crafted, step-by-step solution for a thorough understanding of key concepts.

This is a popular solution!

Trending now
This is a popular solution!

Step by step
Solved in 2 steps

Knowledge Booster


Learn more about
Need a deep-dive on the concept behind this application? Look no further. Learn more about this topic, statistics and related others by exploring similar questions and additional content below.Recommended textbooks for you
Algebra & Trigonometry with Analytic Geometry
Algebra
ISBN:
9781133382119
Author:
Swokowski
Publisher:
Cengage
Algebra & Trigonometry with Analytic Geometry
Algebra
ISBN:
9781133382119
Author:
Swokowski
Publisher:
Cengage