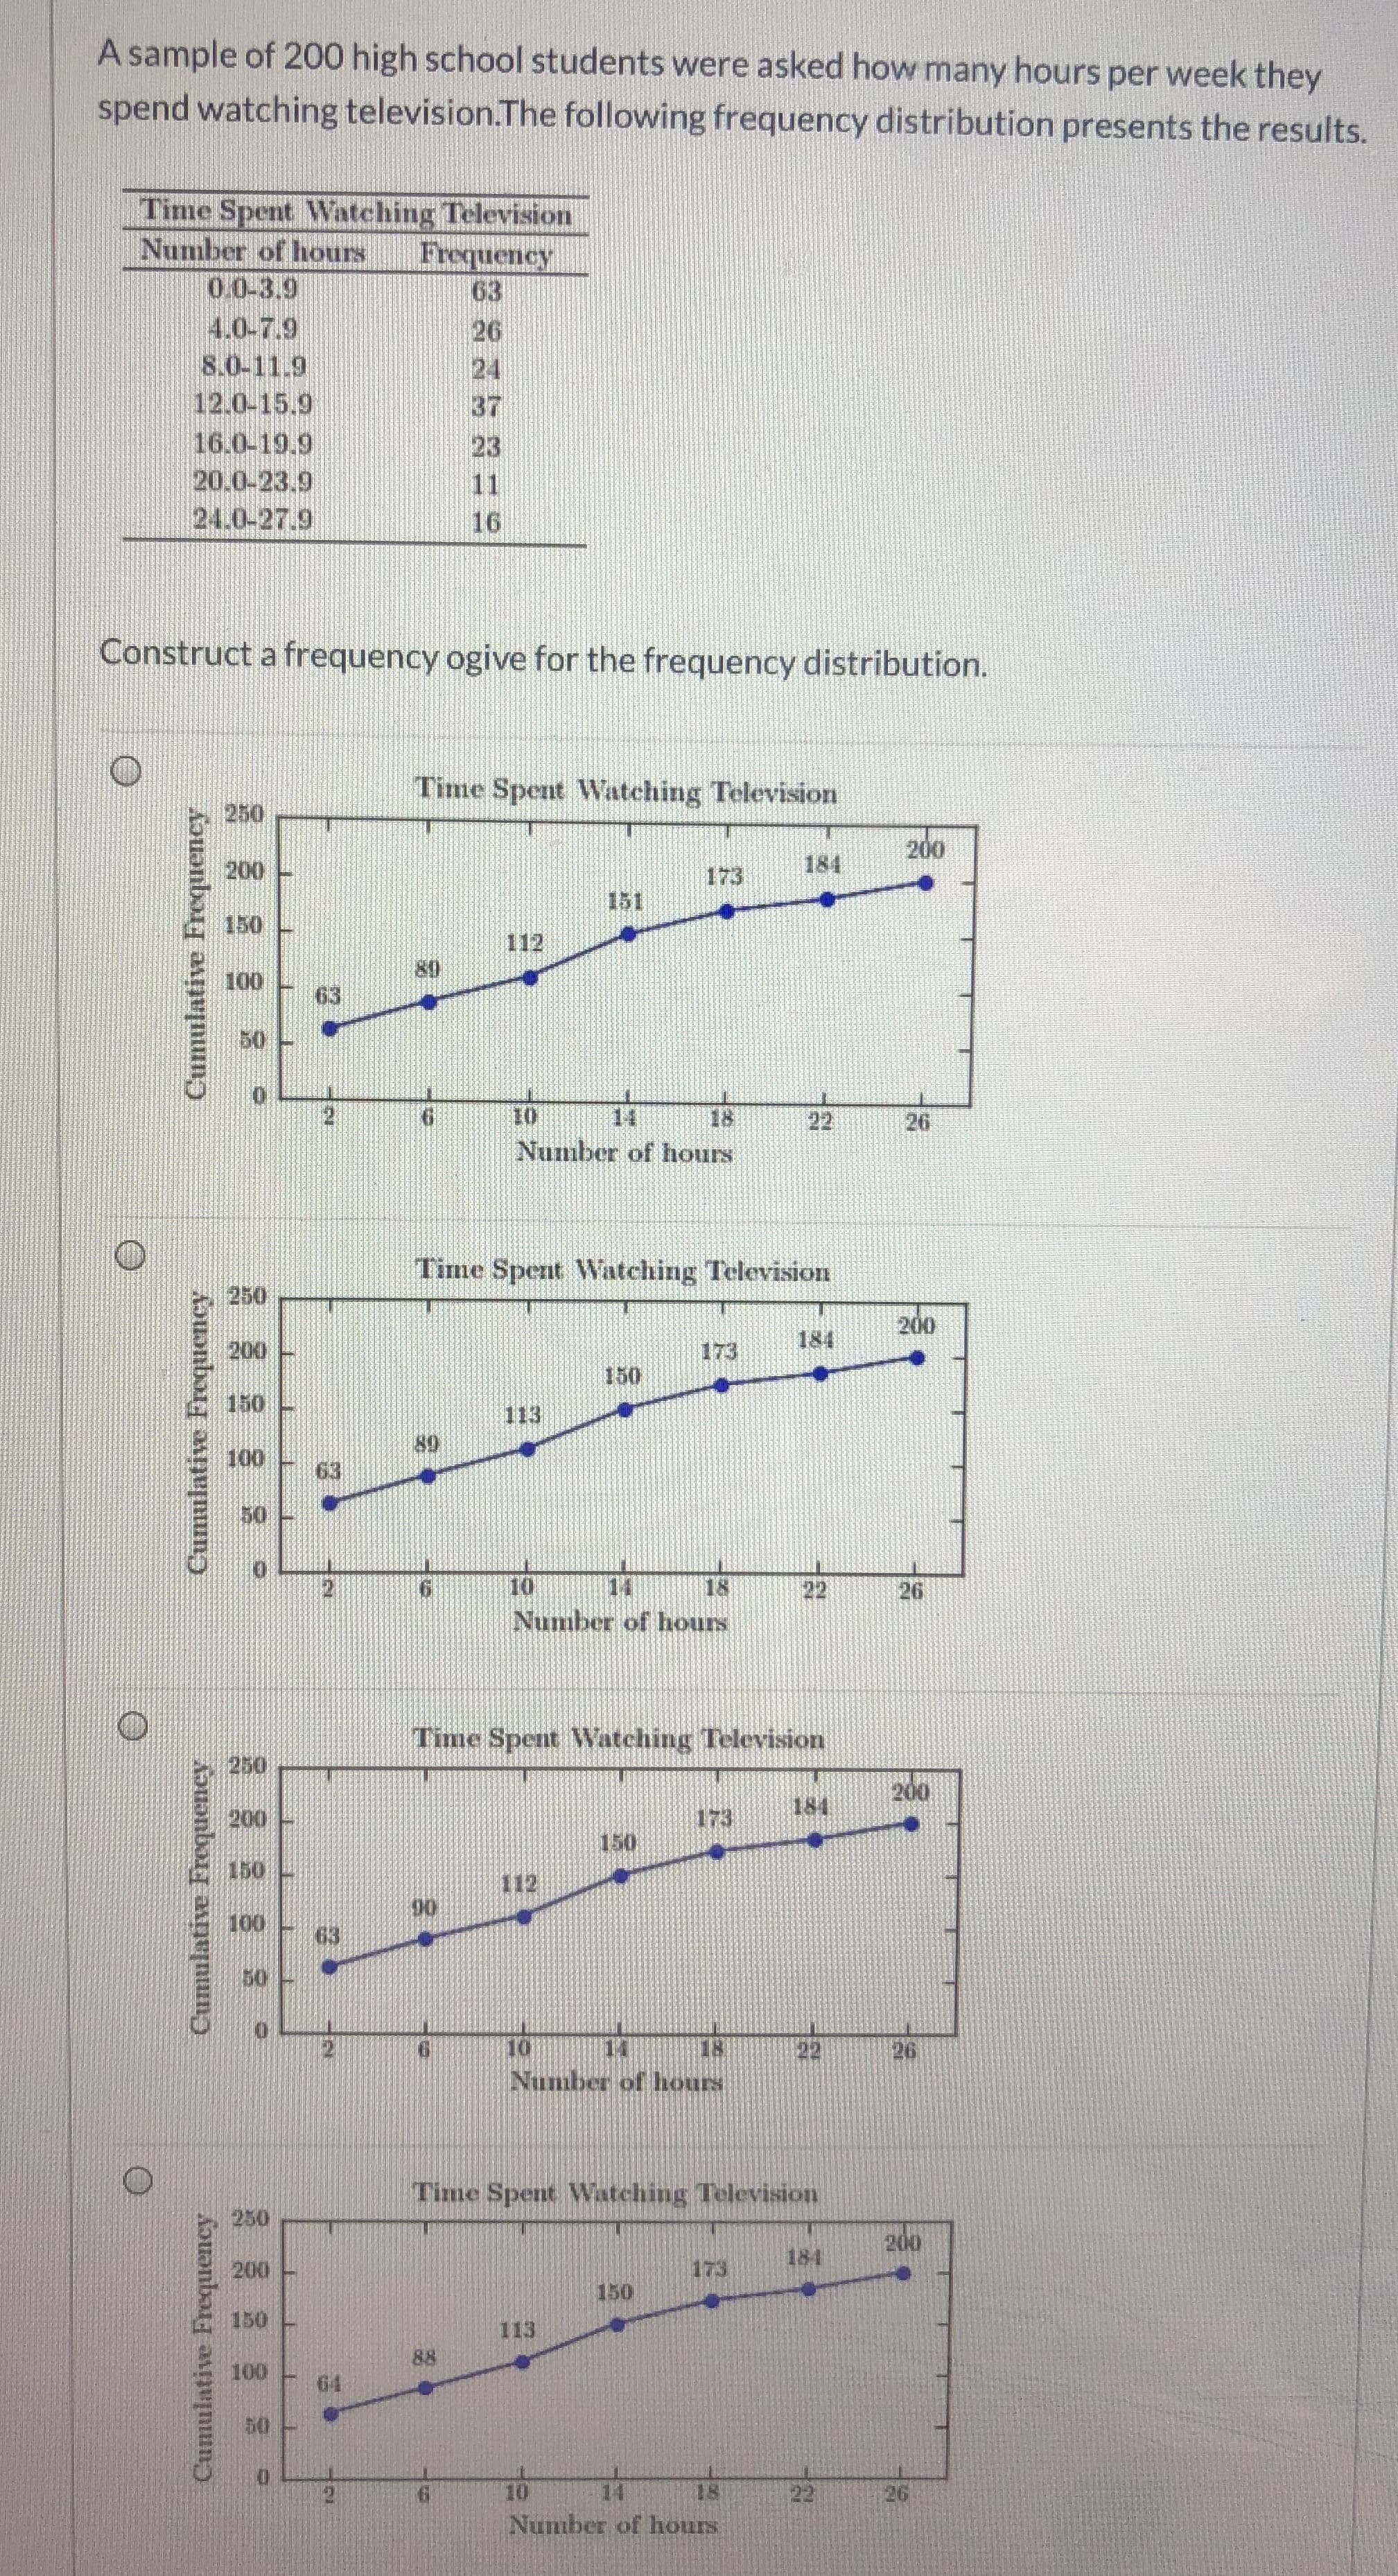
A sample of 200 high school students were asked how many hours per week they spend watching television.The following frequency distribution presents the results. Time Spent Watching Television Number of hours Frequency 63 0.0-3.9 4.0-7.9 26 24 37 8.0-11.9 12.0-15.9 16.0-19.9 20.0-23.9 24.0-27.9 23 11 16 Construct a frequency ogive for the frequency distribution.
A sample of 200 high school students were asked how many hours per week they spend watching television.The following frequency distribution presents the results. Time Spent Watching Television Number of hours Frequency 63 0.0-3.9 4.0-7.9 26 24 37 8.0-11.9 12.0-15.9 16.0-19.9 20.0-23.9 24.0-27.9 23 11 16 Construct a frequency ogive for the frequency distribution.

Glencoe Algebra 1, Student Edition, 9780079039897, 0079039898, 2018
18th Edition
ISBN:9780079039897
Author:Carter
Publisher:Carter
Chapter10: Statistics
Section: Chapter Questions
Problem 13PT

Related questions

Question
100%
Transcribed Image Text:A sample of 200 high school students were asked how many hours per week they
spend watching television.The following frequency distribution presents the results.
Time Spent Watching Television
Number of hours
Frequency
63
0.0-3.9
4.0-7.9
26
24
37
8.0-11.9
12.0-15.9
16.0-19.9
20.0-23.9
24.0-27.9
23
11
16
Construct a frequency ogive for the frequency distribution.
Expert Solution
This question has been solved!
Explore an expertly crafted, step-by-step solution for a thorough understanding of key concepts.

This is a popular solution!

Trending now
This is a popular solution!

Step by step
Solved in 2 steps with 2 images

Knowledge Booster


Learn more about
Need a deep-dive on the concept behind this application? Look no further. Learn more about this topic, statistics and related others by exploring similar questions and additional content below.Recommended textbooks for you
Glencoe Algebra 1, Student Edition, 9780079039897…
Algebra
ISBN:
9780079039897
Author:
Carter
Publisher:
McGraw Hill
Glencoe Algebra 1, Student Edition, 9780079039897…
Algebra
ISBN:
9780079039897
Author:
Carter
Publisher:
McGraw Hill