Examine your data using jamovi: or SPSS Produce appropriate descriptive statistics and graphics – examples of these are measures of central tendency and variability, frequency tables, histograms, and bar charts. Descriptive statistics should be provided for each individual study variable (please note this does not include Student ID
Examine your data using jamovi: or SPSS Produce appropriate descriptive statistics and graphics – examples of these are measures of central tendency and variability, frequency tables, histograms, and bar charts. Descriptive statistics should be provided for each individual study variable (please note this does not include Student ID

MATLAB: An Introduction with Applications
6th Edition
ISBN:9781119256830
Author:Amos Gilat
Publisher:Amos Gilat
Chapter1: Starting With Matlab
Section: Chapter Questions
Problem 1P

Related questions
Question
100%
Examine your data using jamovi: or SPSS Produce appropriate
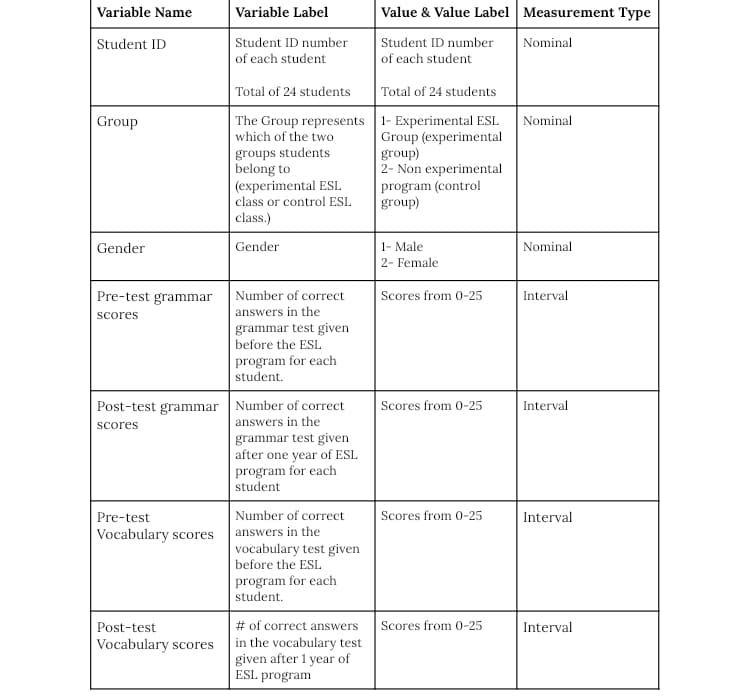
Transcribed Image Text:Variable Name
Variable Label
Value & Value Label Measurement Type
Student ID number
of each student
Student ID
Student ID number
Nominal
of each student
Total of 24 students
Total of 24 students
Group
The Group represents 1- Experimental ESL
Nominal
Group (experimental
group)
2- Non experimental
program (control
group)
which of the two
groups students
belong to
(experimental ESL
class or control ESL
class.)
Gender
Gender
1- Male
Nominal
2- Female
Pre-test grammar
Number of correct
Scores from 0-25
Interval
scores
answers in the
grammar test given
before the ESL
program for each
student.
Post-test grammar Number of correct
Scores from 0-25
Interval
answers in the
scores
grammar test given
after one year of ESL
program for each
student
Number of correct
Scores from 0-25
Interval
Pre-test
Vocabulary scores
answers in the
vocabulary test given
before the ESL.
program for each
student.
# of correct answers Scores from 0-25
in the vocabulary test
given after 1 year of
ESL program
Post-test
Interval
Vocabulary scores
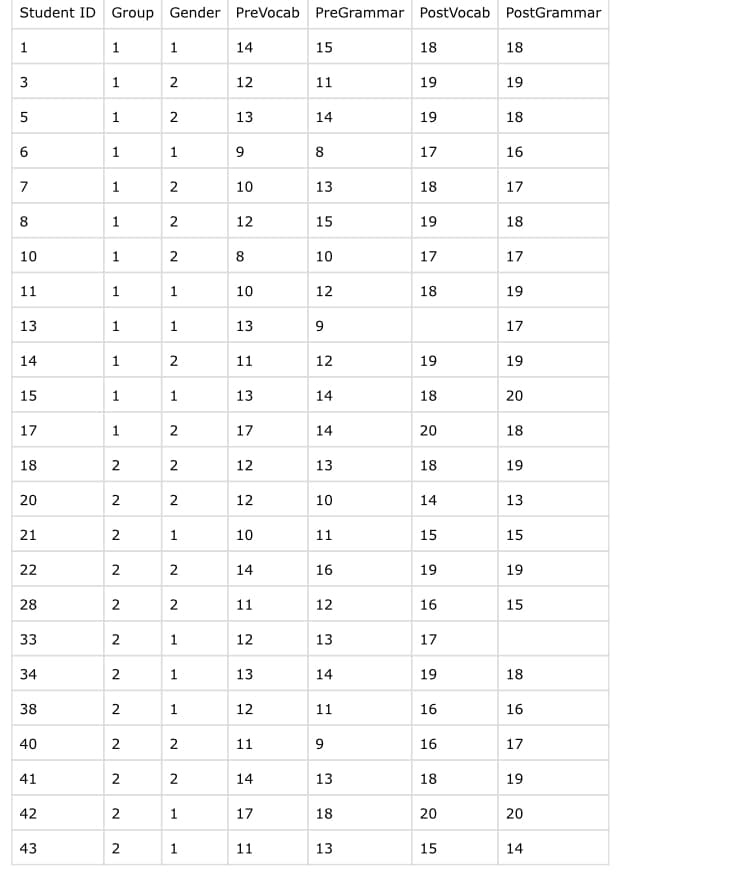
Transcribed Image Text:Student ID Group Gender PreVocab PreGrammar PostVocab PostGrammar
1
1
1
14
15
18
18
3
1
12
11
19
19
5
1
2
13
14
19
18
6
1
1
9
8
17
16
7
1
2
10
13
18
17
8
1
12
15
19
18
10
2
8
10
17
17
11
1
1
10
12
18
19
13
1
1
13
9
17
14
1
2
11
12
19
19
15
1
1
13
14
18
20
17
1
2
17
14
20
18
18
12
13
18
19
20
2
2
12
10
14
13
21
2
1
10
11
15
15
22
2
2
14
16
19
19
28
2
11
12
16
15
33
2
1
12
13
17
34
2
1
13
14
19
18
38
2
1
12
11
16
16
40
2
2
11
9
16
17
41
2
2
14
13
18
19
42
1
17
18
20
20
43
2
1
11
13
15
14
2.
2.
2.
2.
Expert Solution
This question has been solved!
Explore an expertly crafted, step-by-step solution for a thorough understanding of key concepts.

This is a popular solution!

Trending now
This is a popular solution!

Step by step
Solved in 5 steps with 9 images

Recommended textbooks for you
MATLAB: An Introduction with Applications
Statistics
ISBN:
9781119256830
Author:
Amos Gilat
Publisher:
John Wiley & Sons Inc

Probability and Statistics for Engineering and th…
Statistics
ISBN:
9781305251809
Author:
Jay L. Devore
Publisher:
Cengage Learning

Statistics for The Behavioral Sciences (MindTap C…
Statistics
ISBN:
9781305504912
Author:
Frederick J Gravetter, Larry B. Wallnau
Publisher:
Cengage Learning
MATLAB: An Introduction with Applications
Statistics
ISBN:
9781119256830
Author:
Amos Gilat
Publisher:
John Wiley & Sons Inc
Probability and Statistics for Engineering and th…
Statistics
ISBN:
9781305251809
Author:
Jay L. Devore
Publisher:
Cengage Learning
Statistics for The Behavioral Sciences (MindTap C…
Statistics
ISBN:
9781305504912
Author:
Frederick J Gravetter, Larry B. Wallnau
Publisher:
Cengage Learning

Elementary Statistics: Picturing the World (7th E…
Statistics
ISBN:
9780134683416
Author:
Ron Larson, Betsy Farber
Publisher:
PEARSON

The Basic Practice of Statistics
Statistics
ISBN:
9781319042578
Author:
David S. Moore, William I. Notz, Michael A. Fligner
Publisher:
W. H. Freeman

Introduction to the Practice of Statistics
Statistics
ISBN:
9781319013387
Author:
David S. Moore, George P. McCabe, Bruce A. Craig
Publisher:
W. H. Freeman