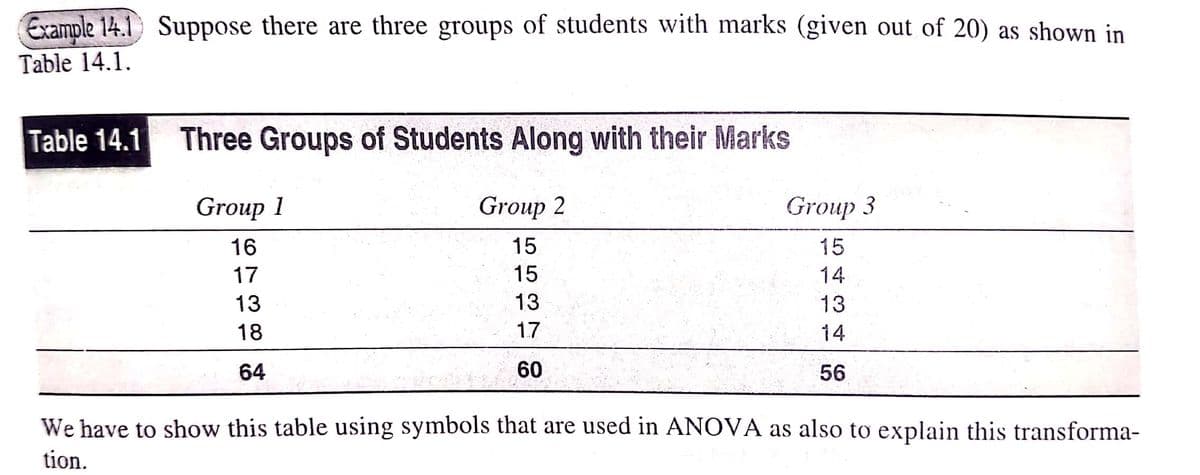
Example 14.1 Suppose there are three groups of students with marks (given out of 20) as shown in Table 14.1. Table 14.1 Three Groups of Students Along with their Marks Group 1 Group 2 Group 3 16 15 15 17 15 14 13 13 13 18 17 14 64 60 56 We have to show this table using symbols that are used in ANOVA as also to explain this transforma- tion.


Q: standard deviations are given in the accompanying table. Treatment n x s Uneaten figs 20 2.80 0.30…
A:
Q: Look at the three graphs. Although they represent different time intervals and none show a perfectly…
A: Data Visualization: When we have a data set and we try to draw conclusions on the basis of it, this…
Q: The following data represent the flight time (in minutes) of a random sample of seven flights from…
A: Formula: RAnge=Maximum value-Minimum value. From the given values, Minimum value=257 and Maximum…
Q: Find the slope from the line of best fit y = -2-X. O -2 0-¹ O O 2
A: Given : The line of best fit y y=-2-12x
Q: The accompanying table describes results from groups of 10 births from 10 different sets of parents.…
A:
Q: What is the column proportion, D, for students who find SAS difficult to learn and who are somewhat…
A: The number of students who find SAS difficult to learn and who are somewhat proficient is 15.
Q: A poll in Canada states that 67% of all respondents favor imposing the death penalty. The poll was…
A: Given that A poll in Canada states that 67% of all respondents favor imposing the death penalty. P…
Q: Select a letter from the choices on the right into each of the drop-down boxes on the left.…
A: Given that ; Here we use statistical concept to identify the symbols.
Q: You are conducting a multinomial hypothesis test for the claim that all 5 categories are equally…
A: Given that the five categories are equally likely. P(A)=P(B)=P(C)=P(D)=P(E)=1/5 Expected…
Q: 02 0.8 32 A Markov chain has transition matrix P = 1 [ J. In the initial state vector, state 1 is…
A: The given transition matrix is, P=0.20.810
Q: 20. Suppose that before any forward guidance was given a bank believed the FFR would have the values…
A: GivenThe table with FFR before guidance and with forward guidance as shown belowYearBefore…
Q: Finding the sample size: Polls are to be conducted in two cities to determine the difference in the…
A: Margin of error (E) = 0.12 Confidence interval = 95%
Q: esc The number of chocolate chips in an 18-ounce bag of chocolate chip cookies is approximately…
A:
Q: music
A: By applying ANOVA test for a single factor,
Q: In "Orthogonal Design for Process Optimization and Its Application to Plasma Etching" (Solid State…
A:
Q: Among 70 exposed people. 15 developed disease and 55 remained healthy. What is the odds of illness…
A: Given: developed disease = 15remained healthy = 55Total exposed = 70
Q: Which of the following is the slope of the regression line for your data on the number server users…
A: From the above data
Q: During the 2010 MLB seasons, the home team won 1,269 games and the away team won 1,371 games. What…
A:
Q: Example 13.14 A survey of 200 firms found the following evidence regarding profitability and marker…
A:
Q: Which of the following events is equally likely to happen? The event with a probability of 0.8. O…
A: Which of the following events is equally likely to happen?
Q: In an introductory stats course x= midterm score and y final exam score. The midterm score had a…
A: Given information: x=midterm score y=final exam score X¯=75sx=4Y¯=83sy=9 r=0.45 Slope: slope=rsysx…
Q: Topic : Housing prices Pose 1 question for the topic • Answering your question must: o Involve…
A: Objective: To come up with a question that will involve collecting, organizing, analysing and…
Q: T-Distribution Statistical Abstracts (117th edition) reports that the average amount spent annually…
A: Assume that μ defines the true average amount spent annually for food by householders under 25 years…
Q: A medical researcher says that less than 72% of adults in a certain country think that healthy…
A:
Q: According to NEA Advocate (2007), the averages for the 2005-2006 academic year, 34 CSU Stanislaus…
A: The provided information is x¯1=$65800x¯2=$72400σ1=$12000σ2=$8000n1=34n2=40α=0.05 The critical value…
Q: Teduh 6. After three exams, Jenny has a mean score of 74. With only one exam remaining in the class,…
A:
Q: Determine whether the quantitative variable is discrete or continuous Numbers of words in a song
A: Determine whether the quantitative variable is discrete or continuous Numbers of words in a song
Q: 8.18 Let X₁,..., X₂, be a random sample from a n(0,0²) population, ² known. An LRT of Ho: 0 = 0o…
A:
Q: Suppose we're interested in seeing whether government investment in clean energy is associated with…
A: Null hypothesis: H0: there is no significant relationship between government investment in clean…
Q: Identify the correct statement concerning, r the correlation coefficie between X and Y and the…
A: Correlation is a measure that measures the strength or degree of relationship between two numerical…
Q: Assume the random variable X is normally distributed with mean µ = 50 and standard deviation o=7.…
A: Let , the random variable X is normally distributed. Mean = μ= 50 Standard deviation = σ = 7
Q: Part 5 Suppose that the observed value of permeability at x = 3.7 is y = 46.1. Calculate the value…
A: It is given: n=14∑yi=572, ∑yi2=23530∑xi=43, ∑xi2=157.42∑xiyi=1697.80
Q: 3. Among 26- to 31-year-olds, 37% say they have danced in public while under the influence of…
A:
Q: Given data is 157, 149, 162, 168, 155, 155, 157.48, 165, 157, 157 sample size (n)=10 sample mean =…
A: Given Sample sizen=10 Sample mean=158.2480 Sample variance=29.6284 Sample standard deviation=5.4432…
Q: The data show the scores of the winning teams in the Rose Bowl. Construct a frequency distribution…
A: Given : No. of Observation = 40 47 30 23 26 26 36 40 22 30 39 36 47 25 36 48 23 19 19 19…
Q: ACTIVITY. From the table below, determine the relationship between number of Facebook friends and…
A: Given information: X Y X^2 Y^2 XY 3889 239 15124321 57121 929471 4999 576 24990001 331776…
Q: anufacturer knows that their items have a normally distributed lifespan, with a mean of 10.5 years,…
A: Given data,Mean μ=10.5sd σ=3.2P(X>4)=?
Q: 2. Let X₁,..., Xn be a random sample from a Bernoulli (0) distribution, where 0 < 0 < 1. (a) Show…
A:
Q: Using the three difference equations listed of the SIR model, create a 3 column population model in…
A: Given Information: Consider the given information. St=99, It=1, Rt=0 ,α=0.001, γ=0.05
Q: (d) What sample size is necessary to estimate true average porosity to within 0.23 with 99%…
A: ( d ) For the given data Find n =?
Q: rm on x'+y' 0. Find
A: It is given that X, Y, are uniform on, x2+y2<1, y>1.
Q: stion 0
A: No, the answer is 0.79
Q: Exampie 13.15) Five coins are tossed 3,200 times and the number of heads appearing each time is…
A:
Q: You wish to test the following claim (HaHa) at a significance level of α=0.001 Ho:p1=p2…
A: Given data : x1= 0.22*636 = 140 n1= 636 x2= 490*0.176 = 86 n2= 490 significance…
Q: Determine whether the study depicts an observational study or an experiment. Fifty patients with…
A:
Q: Which of the following distribution belongs to continuous distribution? A.The temperature at which…
A: Which of the following distribution belongs to continuous distribution?
Q: Problem 1: 1- Plot the p.d.f of Gamma(2, 2) and Gamma(3, 2) in the same plot. 2- Generate 1000…
A: Since you have posted a question with multiple sub-parts, we will solve first three subparts for…
Q: An experiment to compare the spreading rates of five different brands of yellow interior latex paint…
A:
Q: The following items represent the number of birds observed at a given feeder over the past several…
A: Arranging ins descending order 2,19,33,35,48,68,74
Q: res in The data at the right shows the scores of five students in Statistics and Physics quizzes.…
A: Given information: X Y X^2 Y^2 XY 90 89 8100 7921 8010 88 88 7744 7744 7744 88 90 7744…

Step by step
Solved in 2 steps

- The following table gives the total endothermic reactions involving sodium bicarbonate Final Temperature Conditions Number of Reactions 266 K 13 271 K 60 274 K 92 Assume that reactions are independent. What is the mean of the number of reactions until the first final temperature is less than 272K? Report answer to 3 decimal places.The time for the first widget to be manufactured each morning is random between 1 and 3 seconds with a pdf of f(x)=1/162(x-3)^2(x+6) for 0 < x < 6What is the cumulative distribution function, F(x)? What is the probability of a widget being made earlier than 4 s?Answer to four decimal places What is the probability of a widget being made later than 1.3 s?Answer to four decimal placesSuppose that n observations are chosen at random from a continuous pdf fY(y). What is the probability that the last observation recorded will be the smallest number in the sample? I asked this question earlier today, but didn't quite understand all of the response. P(y1<=yn)p(y2<=yn) and so on was used, but shouldn't the yn be listed first in the inequality since we want to know if yn is the smallest?
- A random selection of volunteers at a research institute has been exposed to a weak flu virus. After the volunteers began to have flu symptoms, 10 of them were given multivitamin tablets daily that contained 1 gram of vitamin C and 3 grams of various other vitamins and minerals. The remaining 10 volunteers were given tablets containing 4 grams of vitamin C only. For each individual, the length of time taken to recover from the flu was recorded. At the end of the experiment the following data were obtained. Suppose that it is known that the population standard deviation of recovery time from the flu is 1.8 days when treated with multivitamins and that the population standard deviation of recovery time from the flu is 1.5 days when treated with vitamin C tablets. Suppose also that both populations are approximately normally distributed. Construct a 95% confidence interval for the difference −μ1μ2 between the mean recovery time when treated with multivitamins (μ1) and the mean recovery…A manufacturer claims that the tensile strength of a certain composite (in MPa) has the lognormal distribution with μ = 5 and σ = 0.5. Let X be the strength of a randomly sampled specimen of this composite. a) If the claim is true, what is P(X < 20)? b) Based on the answer to part (a), if the claim is true, would a strength of 20 MPa be unusually small? c) If you observed a tensile strength of 20 MPa, would this be convincing evidence that the claim is false? Explain. d) If the claim is true, what is P(X < 130)? e) Based on the answer to part (d), if the claim is true, would a strength of 130 MPa be unusually small? f) If you observed a tensile strength of 130 MPa, would this be convincing evidence that the claim is false? Explain.Suppose that a study of a certain computer system reveals that the response time, in seconds, has an exponential distribution with density curve f(x) = (1/3)e(-x/3) for x > 0 and f(x) = 0 otherwise. What is the probability that response time exceeds 5 seconds? What is the probability that response time exceeds 10 seconds?
- Suppose that the weight of an newborn fawn is Uniformly distributed between 2.5 and 3.7 kg. Suppose that a newborn fawn is randomly selected. Round answers to 4 decimal places when possible. f. P(x > 3 | x < 3.5) =Suppose that X is a continuous unknown all of whose values are between -3 and 3 and whose PDF, denoted f , is given by f ( x ) = c ( 9 − x^2 ) , − 3 ≤ x ≤ 3 , and where c is a positive normalizing constant. What is the variance of X?2.) The (phi) coefficient for the bivariate table in question #1 above is 0.059. What is its interpretation?
- Consider the time series xt = β1 + β2t + wt, where β1 and β2 are known constants and wt is a white noise process with variance σ2 w. (a) Determine whether xt is stationary. (b) Show that the process yt = xt − xt−1 is stationary. (c) Show that the mean of the moving average vt = 1 2q + 1 q j=−q xt−j is β1 + β2t, and give a simplified expression for the autocovariance function.A random sample of size n = 225 is to be taken from an exponential population with θ = 4. Based on the cen-tral limit theorem, what is the probability that the mean of the sample will exceed 4.5?1.9.5. Let a random variable $X$ of the continuous type have a pdf $f(x)$ whose graph is symmetric with respect to $x=c .$ If the mean value of $X$ exists, show that $E(X)=c$Hint: Show that $E(X-c)$ equals zero by writing $E(X-c)$ as the sum of two integrals: one from $-\infty$ to $c$ and the other from $c$ to $\infty .$ In the first, let $y=c-x$ and, in the second, $z=x-c .$ Finally, use the symmetry condition $f(c-y)=f(c+y)$ in the first.