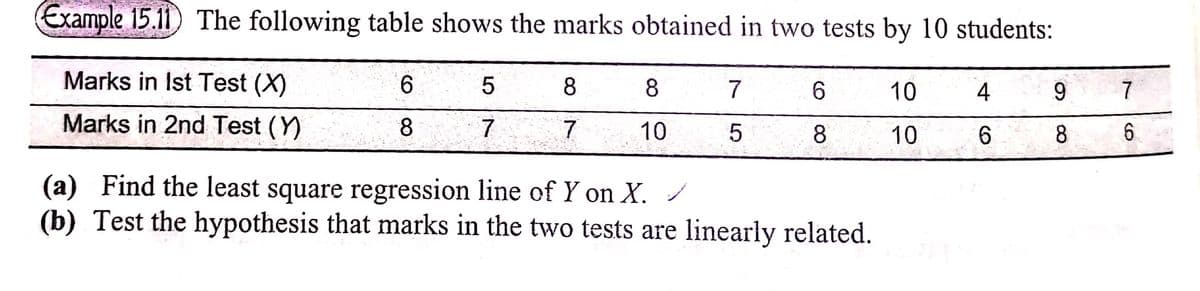
Example 15.11) The following table shows the marks obtained in two tests by 10 students: Marks in Ist Test (X) 9. 8 8 7 6. 10 4 9. 7 Marks in 2nd Test (Y) 7 7 10 8 10 6. 6. (a) Find the least square regression line of Y on X. (b) Test the hypothesis that marks in the two tests are linearly related.


Q: The flights of stairs was measured in this study based on participants reporting the number of…
A:
Q: An agent believes that the average closing cost of purchasing a new home is ₱328,250. She selects 40…
A:
Q: Farmer McGregor is now growing carrots in a field. He is particularly interested in veight of his…
A: Given information: μ=200σ2=400⇒σ=20n=16 plants 1) The probability that the mean of a random sample…
Q: B-1. As a side business, Mr Happy, keeps a fleet of luxury limousines that he rents out to a few…
A: "Since you have posted a question with multiple sub-parts, we will solve the first three sub-parts…
Q: The amount of money Joey takes with him to the floating casino is a random variable Z (in thousands)…
A: Let X denotes the amount of money Joey takes with him to the casino. The PDF of X is given by fx=x18…
Q: respectively. Let f =A prove that 1. f has F distribution with r, and r, degrees of freedom 2. E(f)…
A:
Q: For a T distribution, (a) Find P(T 1.318) when v = 24. (c) Find P(-1.356 -2567) when v= 17
A: Hello! As you have posted more than 3 sub parts, we are answering the first 3 sub-parts. In case…
Q: Q1. The test scores ona test were recorded for 8 students as follows: 71, 93, 91, 86, 75, 73, 86, 82…
A: The number of scores is 8.
Q: The mean life of a certain metal saw blade is 31 hours, with a standard deviation of 4.30 hours.…
A: GivenMean(μ)=31standard deviation(σ)=4.30sample size(n)=40
Q: 5. A researcher is interested in constructing a confidence interval for the number of hours per week…
A: Hey there! Thank you for posting the question. Since your question has more than 3 parts, we are…
Q: Q2 The following data is the pull strength of a wire bond in a semiconductor manufacturing process,…
A:
Q: A box contains a certain number of computer parts, a few of which are defective. Two parts are…
A: Given: A box contains a certain number of computer parts, a few of which are defective. Two parts…
Q: When a is unknown and the sample is of size n 2 30, there are two methods for computing confidence…
A:
Q: You want to obtain a sample to estimate a population proportion. At this point in time, you have no…
A: Given,margin of error(E)=0.01Assume sample proportion(p^)=0.51-p^=0.5α=1-0.98=0.02α2=0.01Z0.01=2.326…
Q: 1. (based on #18, p. 293) The U.S. Army commissioned a study to asses how deeply a bullet penetrates…
A: Given the data as 22.4 29.1 31.7 33.5 35.4 37.4 23.6 29.6 31.9 33.5 35.4 37.5 24 29.7 31.9…
Q: potential savings offered by Diehard, but is also concerned about the quality of the dice produced…
A: D1 D2 D3 D4 D5 6 1 1 6 6 3 5 1 3 6 2 2 1 6 6 5 6 1 1 6 3 4 1 3 6 2 1 1 1 6 2 2 1 2 6…
Q: 5. According to a guidance counselor, an average student spent less than 7 hours each day for school…
A:
Q: Degrees of freedom:| (c) Find the value of the test statistic. (Round to three or more decimal…
A:
Q: Assume the sample variances to be continuous measurements, find the probability that a random sample…
A: N=25 Variance =6 We have to calculate probability for mentioned questions.
Q: A list of managers is compiled and ordered. After a starting number is randomly chosen, every ninth…
A: Given that : Here we use the sampling survey concept to solve this problem.
Q: f) P(90 sxS 115) 9) P(x > 90) h) P(x < 30) ) P(x 2 125) j) P(30 sx s 110)
A:
Q: A popular theory is that presidential candidates have an advantage if they are taller than their…
A:
Q: Ffom an English class of 18 students using programmed materials, 10 are selected at random and given…
A:
Q: 8.12 Crawling babies, Part I. A study conducted at the University of Denver investigated whether…
A: Given that, The temperature is measured in degrees FahrenheitF0 and age is measured in weeks.…
Q: QUESTION 1. Over dinner, your friend mentions an article about a population explosion in Malaysia…
A:
Q: researcher estimates that the average height of buildings in a large city is at least 700 feet.…
A: Solution
Q: Al random sample of companies in electric utilities (1), financial services (II), and food…
A: The one way anova is used to test whether any significance difference between the means of more than…
Q: In 1995, Cook County, Illinois (1.4 million households), conducted a study to determine how far the…
A: N=2518 Mean =42.6 Standard deviation =16.7 Average =42 We have to test hypothesis.
Q: (a) State the null hypothesis H and the alternate hypothesis H,- Español H, :0 H :0 (b) Determine…
A: Given that, an engineer working for a large has developed two types of soil additives he calls Add1…
Q: Lef x~N(U,0*), Show that the MGF x is etHifto? of 13
A:
Q: 3)D,E,F,G
A: Let X be a random variable denoting the unsuccessful wrapping of the chocolate by the machine. Then,…
Q: iid ulo, @) find minimum Sat fiei SaPficient
A:
Q: SHOW ALL WORK. EITHER WORKED BY HAND OR EXCEL FILE. The life expectancy in the United States is 75…
A:
Q: The average cost per household of owning a brand new car is ₱5500. Suppose that we randomly selected…
A: Let X be the random variable from normal distribution with mean (μ) = 5500, standard deviation (σ) =…
Q: What is the correct alternative hypothesis for the following conjecture – the average price of a 1/2…
A: Given that Population mean μ =39800 Alternative hypothesis is H1.
Q: Fifteen women were enrolled in a slimming program for a period of 8 weeks. Their weights were taken…
A: Given that Fifteen women were enrolled in a slimming program for a period of 8 weeks. Their weights…
Q: Q 4/ After collecting considerable data, the engineers decided to model the variation in shaft…
A:
Q: 2. A principal at a school claims that the students in his school are above average intelligence. A…
A:
Q: An archer’s standard deviation for his hits is six (data is measured in distance from the center of…
A: Solution-: Given: σ0=6 An archer’s standard deviation for his hits is six (data is measured in…
Q: vacuum cleaners. The weights are classified according to vacuum cleaner type. At a=0.10, can you…
A: For the given data Perform Anova: Single Factor
Q: The mean weight of adult American men is 180 pounds with standard deviation of 25 pounds. The…
A: Given The mean weight of adult American men is 180 pounds standard deviation of 25 pounds. The…
Q: the damage in each case was assessed, and the relevant data are shown in the accompanying table;…
A: Anova is used to measure the mean significant difference between the three or more variable. It is a…
Q: 8.3: t Test for Mean: Population Standard Deviation Unknown Score: 4.55/11 4/11 answered Progre •…
A:
Q: What is the standard deviation of the data {7, 1, 7, 10, 5, 3, 2}?
A:
Q: Q 1/ Given a random variable having the normal distribution with u=16 and o?=1.5625. Find the…
A:
Q: students is smaller than 2.4 at the .10 significance level. The null and alternative hypothesis…
A: Given that Hypothesized Population Mean (\mu)(μ) = 2.42.4 Population Standard Deviation…
Q: For each item, identify if the type of sample is related or independent. 1. Gorgeous believes that…
A: Independent variable is also known as cause. It does not affected by another variable but it affect…
Q: toward 17.5% of the final grade, and the final exam counts for 30%. If a student 22. A teacher bases…
A: NOTE-AS PER POLICY I HAVE CALCUATED FIRST MAIN QUESTION ONLY Here Student has 4 exam and one final…
Q: Q-3 If P(A) = 0.2, P(B) = 0.3, and P(A n B) = 0.1, determine the following probabilities: b. P(A U…
A: Given,P(A)=0.2P(B)=0.3P(A∩B)=0.1
Q: t- distribution is a probability distribution used to estimate parameters EXCEPT when: a. The…
A: In this case we need to identify the correct option for the given statement.

Step by step
Solved in 4 steps with 4 images

- Olympic Pole Vault The graph in Figure 7 indicates that in recent years the winning Olympic men’s pole vault height has fallen below the value predicted by the regression line in Example 2. This might have occurred because when the pole vault was a new event there was much room for improvement in vaulters’ performances, whereas now even the best training can produce only incremental advances. Let’s see whether concentrating on more recent results gives a better predictor of future records. (a) Use the data in Table 2 (page 176) to complete the table of winning pole vault heights shown in the margin. (Note that we are using x=0 to correspond to the year 1972, where this restricted data set begins.) (b) Find the regression line for the data in part ‚(a). (c) Plot the data and the regression line on the same axes. Does the regression line seem to provide a good model for the data? (d) What does the regression line predict as the winning pole vault height for the 2012 Olympics? Compare this predicted value to the actual 2012 winning height of 5.97 m, as described on page 177. Has this new regression line provided a better prediction than the line in Example 2?8)Suppose that Y is normal and we have three explanatory unknowns which are also normal, and we have an independent random sample of 11 members of the population, where for each member, the value of Y as well as the values of the three explanatory unknowns were observed. The data is entered into a computer using linear regression software and the output summary tells us that R-square is 0.86, the linear model coefficient of the first explanatory unknown is 7 with standard error estimate 2.5, the coefficient for the second explanatory unknown is 11 with standard error 2, and the coefficient for the third explanatory unknown is 15 with standard error 4. The regression intercept is reported as 28. The sum of squares in regression (SSR) is reported as 86000 and the sum of squared errors (SSE) is 14000. From this information, what is MSE/MST? .5000 NONE OF THE OTHERS .2000 .3000 .40009)Suppose that Y is normal and we have three explanatory unknowns which are also normal, and we have an independent random sample of 11 members of the population, where for each member, the value of Y as well as the values of the three explanatory unknowns were observed. The data is entered into a computer using linear regression software and the output summary tells us that R-square is 0.79, the linear model coefficient of the first explanatory unknown is 7 with standard error estimate 2.5, the coefficient for the second explanatory unknown is 11 with standard error 2, and the coefficient for the third explanatory unknown is 15 with standard error 4. The regression intercept is reported as 28. The sum of squares in regression (SSR) is reported as 79000 and the sum of squared errors (SSE) is 21000. From this information, what is the adjusted R-square? .8 .7 NONE OF THE OTHERS .6 .5
- 1. Prior to being hired, the ve salespersons for a computer store were given a standard sales aptitude test. For each individual, the score achieved on the aptitude test and the number of computer systems sold during the first 3 months of their employment are shown in the attached image. (a) Determine the least-squares regression line and interpret its slope. (b) Estimate, for a new employee who scores 60 on the sales aptitude test, the number of units the new employee will sell in her first 3 months with the company. (c) Find the standard error of estimate. (d) Find the r-square of the model.Suppose the simple linear regression model, Yi = β0 + β1 xi + Ei, is used to explain the relationship between x and y. A random sample of n = 12 values for the explanatory variable (x) was selected and the corresponding values of the response variable (y) were observed. A summary of the statistics is presented in the photo attached. Let b1 denote the least squares estimator of the slope coefficient, β1. What is the value of b1?The least-squares regression equation is y=761.7x+13,208 where y is the median income and x is the percentage of 25 years and older with at least a bachelor's degree in the region. The scatter diagram indicates a linear relation between the two variables with a correlation coefficient of 0.7483. Predict the median income of a region in which 20% of adults 25 years and older have at least a bachelor's degree.
- 17) Suppose that Y is normal and we have three explanatory unknowns which are also normal, and we have an independent random sample of 41 members of the population, where for each member, the value of Y as well as the values of the three explanatory unknowns were observed. The data is entered into a computer using linear regression software and the output summary tells us that R-square is 0.9, the linear model coefficient of the first explanatory unknown is 7 with standard error estimate 2.5, the coefficient for the second explanatory unknown is 11 with standard error 2, and the coefficient for the third explanatory unknown is 15 with standard error 4. The regression intercept is reported as 28. The sum of squares in regression (SSR) is reported as 90000 and the sum of squared errors (SSE) is 10000. From this information, what is the number of degrees of freedom for the t-distribution used to compute critical values for hypothesis tests and confidence intervals for the individual…Suppose that a researcher, using wage data on 200 randomly selected male workers and 240female workers, estimates the OLS regressionW age ˆ =10(0.2)+2(0.4)× M ale, R2 = 0.10, SER = 4,where Wage is measured in dollars per hour and Male is a binary variable that is equal to 1 if theperson is a male and 0 if the person is a female. Define the wage gender gap as the difference inmean earnings between men and women.1. What is the estimated gender gap?2. Is the estimated gender gap significantly different from 0? (Compute the p-value for testingthe null hypothesis that there is no gender gap.)13. Construct a 95% confidence interval for the gender gap.4. In the sample, what is the mean wage of women? Of men?5. Another researcher uses these same data but regresses Wages on Female, a variable that isequal to 1 if the person is female and 0 if the person a male. What are the regression estimatescalculated from this regression?W age ˆ = _ + _ × F emale, R2 = _, SER = _.In a regression based on 30 annual observations, U.S. farm income was related to four independent variables—grain exports, federal government subsidies, population, and a dummy variable for bad weather years. The model was fitted by least squares, resulting in a Durbin-Watson statistic of 1.29. The regression of e2i on ŷi yielded a coefficient of determination of 0.043.a. Test for heteroscedasticity.b. Test for autocorrelated errors.
- The coefficients in a distributed lag regression of Y on X and its lags can be interpreted as the dynamic causal effects when the time path of X is determined randomly and independently of other factors that influence Y. Explain How?The y-interept bo of a least-squares regression line has a useful interpretation only if the x-values are either all positive or all negative. Determine if the statement is true or false. Why? If the statement is false, rewrite as a true statement.uppose IQ scores were obtained from randomly selected couplescouples. For 2020 such pairs of people, the linear correlation coefficient is 0.8900.890 and the equation of the regression line is ModifyingAbove y with caret equals negative 0.74 plus 1.02 xy=−0.74+1.02x, where x represents the IQ score of the husbandhusband. Also, the 2020 x values have a mean of 101.17101.17 and the 2020 y values have a mean of 102.7102.7. What is the best predicted IQ of the wifewife, given that the husbandhusband has an IQ of 9999? Use a significance level of 0.05. The best predicted IQ of the wifewife is nothing. (Round to two decimal places as needed.
