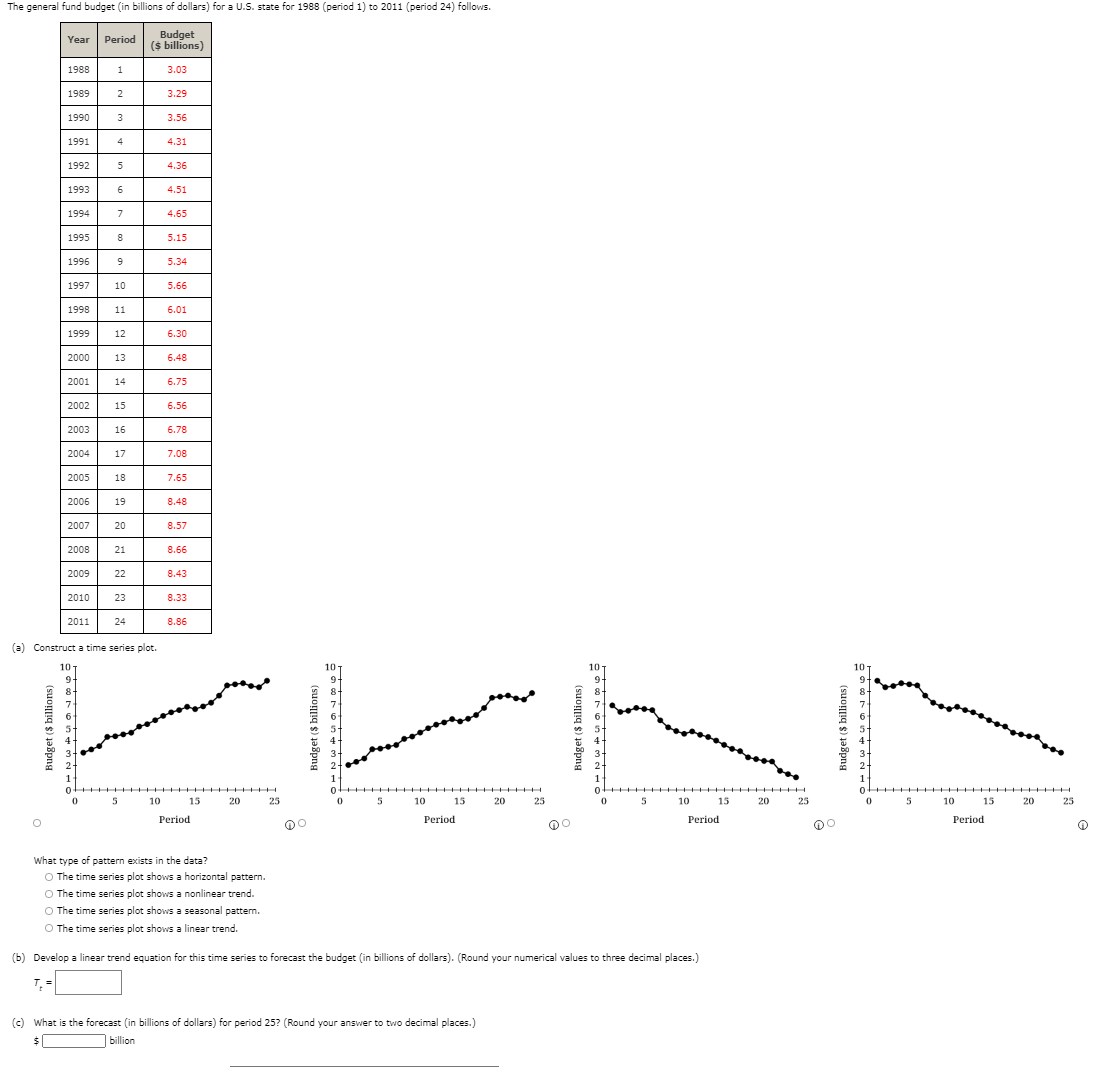
The general fund budget (in billions of dollars) for a U.S. state for 1988 (period 1) to 2011 (period 24) follows. Year Period Budget ($ billions) 1988 1 3.03 1989 2 3.29 1990 3 3.56 1991 4 4.31 1992 5 4.36 1993 6 4.51 1994 7 4.65 1995 8 5.15 1996 9 5.34 1997 10 5.66 1998 11 6.01 1999 12 6.30 2000 13 6.48 2001 14 6.75 2002 15 6.56 2003 16 6.78 2004 17 7.08 2005 18 7.65 2006 19 8.48 2007 20 8.57 2008 21 8.66 2009 22 8.43 2010 23 8.33 2011 24 8.86 (a) Construct a time series plot. A time series plot contains a series of 24 points connected by line segments. The horizontal axis ranges from 0 to 25 and is labeled: Period. The vertical axis ranges from 0 to 10 and is labeled: Budget ($ billions). The first point is at approximately (1, 3.0). The rest are plotted from left to right at regular increments of 1 period in an upward, diagonal direction. The last point is at approximately (24, 8.9). Consecutive points are close together with little scatter. A time series plot contains a series of 24 points connected by line segments. The horizontal axis ranges from 0 to 25 and is labeled: Period. The vertical axis ranges from 0 to 10 and is labeled: Budget ($ billions). The first point is at approximately (1, 2.0). The rest are plotted from left to right at regular increments of 1 period in an upward, diagonal direction. The last point is at approximately (24, 7.9). Consecutive points are close together with little scatter. A time series plot contains a series of 24 points connected by line segments. The horizontal axis ranges from 0 to 25 and is labeled: Period. The vertical axis ranges from 0 to 10 and is labeled: Budget ($ billions). The first point is at approximately (1, 6.9). The rest are plotted from left to right at regular increments of 1 period in a downward, diagonal direction. The last point is at approximately (24, 1.0). Consecutive points are close together with little scatter. A time series plot contains a series of 24 points connected by line segments. The horizontal axis ranges from 0 to 25 and is labeled: Period. The vertical axis ranges from 0 to 10 and is labeled: Budget ($ billions). The first point is at approximately (1, 8.9). The rest are plotted from left to right at regular increments of 1 period in a downward, diagonal direction. The last point is at approximately (24, 3.0). Consecutive points are close together with little scatter. What type of pattern exists in the data? The time series plot shows a horizontal pattern.The time series plot shows a nonlinear trend. The time series plot shows a seasonal pattern.The time series plot shows a linear trend. (b) Develop a linear trend equation for this time series to forecast the budget (in billions of dollars). (Round your numerical values to three decimal places.) Tt = (c) What is the forecast (in billions of dollars) for period 25? (Round your answer to two decimal places.) $ billion
The general fund budget (in billions of dollars) for a U.S. state for 1988 (period 1) to 2011 (period 24) follows. Year Period Budget ($ billions) 1988 1 3.03 1989 2 3.29 1990 3 3.56 1991 4 4.31 1992 5 4.36 1993 6 4.51 1994 7 4.65 1995 8 5.15 1996 9 5.34 1997 10 5.66 1998 11 6.01 1999 12 6.30 2000 13 6.48 2001 14 6.75 2002 15 6.56 2003 16 6.78 2004 17 7.08 2005 18 7.65 2006 19 8.48 2007 20 8.57 2008 21 8.66 2009 22 8.43 2010 23 8.33 2011 24 8.86 (a) Construct a time series plot. A time series plot contains a series of 24 points connected by line segments. The horizontal axis ranges from 0 to 25 and is labeled: Period. The vertical axis ranges from 0 to 10 and is labeled: Budget ($ billions). The first point is at approximately (1, 3.0). The rest are plotted from left to right at regular increments of 1 period in an upward, diagonal direction. The last point is at approximately (24, 8.9). Consecutive points are close together with little scatter. A time series plot contains a series of 24 points connected by line segments. The horizontal axis ranges from 0 to 25 and is labeled: Period. The vertical axis ranges from 0 to 10 and is labeled: Budget ($ billions). The first point is at approximately (1, 2.0). The rest are plotted from left to right at regular increments of 1 period in an upward, diagonal direction. The last point is at approximately (24, 7.9). Consecutive points are close together with little scatter. A time series plot contains a series of 24 points connected by line segments. The horizontal axis ranges from 0 to 25 and is labeled: Period. The vertical axis ranges from 0 to 10 and is labeled: Budget ($ billions). The first point is at approximately (1, 6.9). The rest are plotted from left to right at regular increments of 1 period in a downward, diagonal direction. The last point is at approximately (24, 1.0). Consecutive points are close together with little scatter. A time series plot contains a series of 24 points connected by line segments. The horizontal axis ranges from 0 to 25 and is labeled: Period. The vertical axis ranges from 0 to 10 and is labeled: Budget ($ billions). The first point is at approximately (1, 8.9). The rest are plotted from left to right at regular increments of 1 period in a downward, diagonal direction. The last point is at approximately (24, 3.0). Consecutive points are close together with little scatter. What type of pattern exists in the data? The time series plot shows a horizontal pattern.The time series plot shows a nonlinear trend. The time series plot shows a seasonal pattern.The time series plot shows a linear trend. (b) Develop a linear trend equation for this time series to forecast the budget (in billions of dollars). (Round your numerical values to three decimal places.) Tt = (c) What is the forecast (in billions of dollars) for period 25? (Round your answer to two decimal places.) $ billion

MATLAB: An Introduction with Applications
6th Edition
ISBN:9781119256830
Author:Amos Gilat
Publisher:Amos Gilat
Chapter1: Starting With Matlab
Section: Chapter Questions
Problem 1P

Related questions
Question
The general fund budget (in billions of dollars) for a U.S. state for 1988 (period 1) to 2011 (period 24) follows.
| Year | Period | Budget ($ billions) |
|---|---|---|
| 1988 | 1 | 3.03 |
| 1989 | 2 | 3.29 |
| 1990 | 3 | 3.56 |
| 1991 | 4 | 4.31 |
| 1992 | 5 | 4.36 |
| 1993 | 6 | 4.51 |
| 1994 | 7 | 4.65 |
| 1995 | 8 | 5.15 |
| 1996 | 9 | 5.34 |
| 1997 | 10 | 5.66 |
| 1998 | 11 | 6.01 |
| 1999 | 12 | 6.30 |
| 2000 | 13 | 6.48 |
| 2001 | 14 | 6.75 |
| 2002 | 15 | 6.56 |
| 2003 | 16 | 6.78 |
| 2004 | 17 | 7.08 |
| 2005 | 18 | 7.65 |
| 2006 | 19 | 8.48 |
| 2007 | 20 | 8.57 |
| 2008 | 21 | 8.66 |
| 2009 | 22 | 8.43 |
| 2010 | 23 | 8.33 |
| 2011 | 24 | 8.86 |
(a)
Construct a time series plot.
A time series plot contains a series of 24 points connected by line segments. The horizontal axis ranges from 0 to 25 and is labeled: Period. The vertical axis ranges from 0 to 10 and is labeled: Budget ($ billions). The first point is at approximately (1, 3.0). The rest are plotted from left to right at regular increments of 1 period in an upward, diagonal direction. The last point is at approximately (24, 8.9). Consecutive points are close together with little scatter.
A time series plot contains a series of 24 points connected by line segments. The horizontal axis ranges from 0 to 25 and is labeled: Period. The vertical axis ranges from 0 to 10 and is labeled: Budget ($ billions). The first point is at approximately (1, 2.0). The rest are plotted from left to right at regular increments of 1 period in an upward, diagonal direction. The last point is at approximately (24, 7.9). Consecutive points are close together with little scatter.
A time series plot contains a series of 24 points connected by line segments. The horizontal axis ranges from 0 to 25 and is labeled: Period. The vertical axis ranges from 0 to 10 and is labeled: Budget ($ billions). The first point is at approximately (1, 6.9). The rest are plotted from left to right at regular increments of 1 period in a downward, diagonal direction. The last point is at approximately (24, 1.0). Consecutive points are close together with little scatter.
A time series plot contains a series of 24 points connected by line segments. The horizontal axis ranges from 0 to 25 and is labeled: Period. The vertical axis ranges from 0 to 10 and is labeled: Budget ($ billions). The first point is at approximately (1, 8.9). The rest are plotted from left to right at regular increments of 1 period in a downward, diagonal direction. The last point is at approximately (24, 3.0). Consecutive points are close together with little scatter.
What type of pattern exists in the data?
The time series plot shows a horizontal pattern.The time series plot shows a nonlinear trend. The time series plot shows a seasonal pattern.The time series plot shows a linear trend.
(b)
Develop a linear trend equation for this time series to forecast the budget (in billions of dollars). (Round your numerical values to three decimal places.)
Tt =
(c)
What is the forecast (in billions of dollars) for period 25? (Round your answer to two decimal places.)
$ billion
Transcribed Image Text:The general fund budget (in billions of dollars) for a U.S. state for 1988 (period 1) to 2011 (period 24) follows.
Budget
($ billions)
Year
Period
1988
1
3.03
1989
2
3.29
1990
3
3.56
1991
4
4.31
1992
5
4.36
1993
6
4.51
1994
7
4.65
1995
8
5.15
1996
5.34
1997
10
5.66
1998
11
6.01
1999
12
6.30
2000
13
6.48
2001
14
6.75
2002
15
6.56
2003
16
6.78
2004
17
7.08
2005
18
7.65
2006
19
8.48
2007
20
8.57
2008
21
8.66
2009
22
8.43
2010
23
8.33
2011
24
8.86
(a) Construct a time series plot.
10
10
10
10
1.
1
H
25
5
10
15
20
25
5
10
15
20
25
10
15
20
23
5
10
15
20
Period
Period
Period
Period
What type of pattern exists in the data?
O The time series plot shows a horizontal pattern.
O The time series plot shows a nonlinear trend.
O The time series plot shows a seasonal pattem.
O The time series plot shows a linear trend.
(b) Develop a linear trend equation for this time series to forecast the budget (in billions of dollars). (Round your numerical values to three decimal places.)
(c) What is the forecast (in billions of dollars) for period 25? (Round your answer to two decimal places.)
billion
Budget ($ billions)
Budget ($ billions)
Budget ($ billions)
Budget ($ billions)
Expert Solution
This question has been solved!
Explore an expertly crafted, step-by-step solution for a thorough understanding of key concepts.

This is a popular solution!

Trending now
This is a popular solution!

Step by step
Solved in 4 steps with 3 images

Knowledge Booster


Learn more about
Need a deep-dive on the concept behind this application? Look no further. Learn more about this topic, statistics and related others by exploring similar questions and additional content below.Recommended textbooks for you
MATLAB: An Introduction with Applications
Statistics
ISBN:
9781119256830
Author:
Amos Gilat
Publisher:
John Wiley & Sons Inc

Probability and Statistics for Engineering and th…
Statistics
ISBN:
9781305251809
Author:
Jay L. Devore
Publisher:
Cengage Learning

Statistics for The Behavioral Sciences (MindTap C…
Statistics
ISBN:
9781305504912
Author:
Frederick J Gravetter, Larry B. Wallnau
Publisher:
Cengage Learning
MATLAB: An Introduction with Applications
Statistics
ISBN:
9781119256830
Author:
Amos Gilat
Publisher:
John Wiley & Sons Inc
Probability and Statistics for Engineering and th…
Statistics
ISBN:
9781305251809
Author:
Jay L. Devore
Publisher:
Cengage Learning
Statistics for The Behavioral Sciences (MindTap C…
Statistics
ISBN:
9781305504912
Author:
Frederick J Gravetter, Larry B. Wallnau
Publisher:
Cengage Learning

Elementary Statistics: Picturing the World (7th E…
Statistics
ISBN:
9780134683416
Author:
Ron Larson, Betsy Farber
Publisher:
PEARSON

The Basic Practice of Statistics
Statistics
ISBN:
9781319042578
Author:
David S. Moore, William I. Notz, Michael A. Fligner
Publisher:
W. H. Freeman

Introduction to the Practice of Statistics
Statistics
ISBN:
9781319013387
Author:
David S. Moore, George P. McCabe, Bruce A. Craig
Publisher:
W. H. Freeman