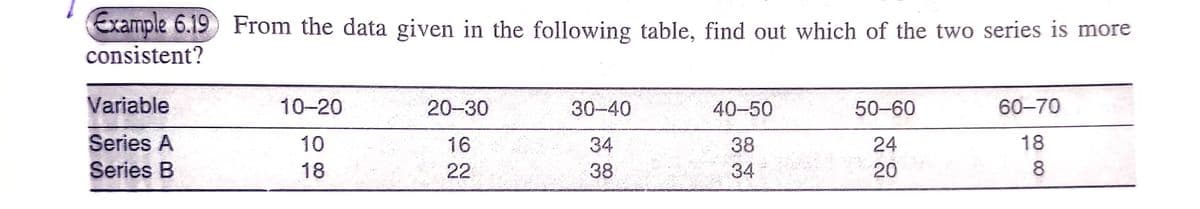
Example 6.19 From the data given in the following table, find out which of the two series is more consistent? Variable 10-20 20-30 30-40 40-50 50-60 60-70 Series A 10 16 34 38 24 18 Series B 18 22 38 34-05 20 8
Q: E X(1) + X(2) X (n)
A:
Q: Suppose the probability of a major earthquake on a given day is 1 out of 20,000. Complete parts a…
A:
Q: 1. Survey tests on leadership skills and on self-concept were administered to student-leaders. Both…
A: Since there are multiple parts, I solved 4 steps as per Bartleby rules. Please post the remaining…
Q: Explicate a null and alternative hypothesis in words and symbol and tell whether the test is…
A: Null hypothesis: The hypo. that shows no significant difference between the given observations. It…
Q: EVALUATE THIS PROBLEM: (SHOW YOUR SOLUTION) 1. The score of 120 SHS students in their First…
A:
Q: Consider the following table: Source SS DF MS Test Statistic Regression 6 745.77 Error…
A: Given Source SS DF MS Test Statistic Regression 6 745.77 Error ? 788.51 Total…
Q: Ex/ Let X~Beta (x, B) Find Location sacale family for B distribution
A: Given that X follows beta distribution with alpha and beta We have to find exponential family for…
Q: 2. The manager of a fabric company needs to accurately forecast the demand for fabric. If the…
A: The question is based on a time series Given :
Q: A recent study of the hourly wages of crew members for major airlines showed that the mean hourly…
A:
Q: A company wants to determine whether s consumer product ratings (0-10) have changed from last year…
A:
Q: Based on the ANOVA table given, is there enough evidence at the 0.050.05 level of significance to…
A: Based on the ANOVA table given, is there enough evidence at the 0.050.05 level of significance to…
Q: Statistic question for signals please help. Let Z(t)=X(t)+Y(t), where X(t) and Y(t) are independent…
A:
Q: The data is as follows: 2 0's, 6 1's, 10 2's, 32 3's, 50 4's, 69 5's, 50 6's, 38 7's, 19 8's, 12…
A: Given data: 2 0's, 6 1's, 10 2's, 32 3's, 50 4's, 69 5's, 50 6's, 38 7's, 19 8's, 12 9's, and 4 10's…
Q: According to Money, 13 percent of all households own stocks. An economist wants to test this claim…
A:
Q: Students investigated the packaging of potato chips. They purchased 6 randomly selected bags of…
A: Given that
Q: A manufacturer suspects that the batches of raw material furnished by his supplier differ…
A: Note: As per the guidelines, in case of multiple subparts, answer to first three subparts will be…
Q: Example 20.21 Assuming that all the products can be assigned equal weights, calculate the chain-base…
A:
Q: c. What is the probability that x will be at least 3 in Distribution A? P(x ≥ 3) = (Type an integer…
A: The table A and B shows the probability distribution of A and B.
Q: To construct a confidence interval for the difference between two population means μ₁-H₂, use the…
A:
Q: An automobile executive wishes to estimate the average of miles driven per year on a particular…
A:
Q: What are some tips or advice to understnding the central therom limit?
A:
Q: Step 2 of 3: Find the margin of error to be used in constructing the confidence interval. Round your…
A: Given: n1=13x¯1=180s1=20n2=6x¯2=197s2=11
Q: 5) f(xu, x (a) Show that the statistic X =
A: *
Q: P(Red)?
A: The provided information is Color Frequency Red 22 Yellow 9 Green 41 Blue 28 Total…
Q: T-TEST FOR INDEPENDENT MEANS 1. Two types of instruments for measuring the amount of sulfur monoxide…
A:
Q: A sample of n=16 individuals is selected from a population with a mean (µ)= 80 and standard…
A:
Q: At Intel, the sizes of processor chips have a mean of 1 cm with a standard deviation of 0.2 cm.…
A:
Q: (a) (b) (c) (d) (e) (f) 0 otherwise Find the cumulative distribution function F(x) P(X ≤ 2) P(X 2)…
A: Given: The pdf of discrete random variable X is f(X)=16 ; X=0,213 ; X=1,30 otherwise We have to…
Q: Thirty-four automobiles were tested for fuel efficiency (in miles per gallon). The following…
A: We have given that, Class boundaries Frequency 7.5 - 12.5 3 12.5 - 17.5 9 17.5 - 22.5 14…
Q: (a) Why is it important to randomly expose the baby to the helper or hinderer toy first? OA. The…
A: Since you have posted a question with multiple sub-parts, we will solve first three subparts for…
Q: e pass completion percentages of 10 college football quarterbacks for their freshman and sophomore…
A:
Q: The data file includes the text of three books of the Bible (Joshua, Jonah and Philippians) using…
A: Given information: Total number of letters to be assigned = 26
Q: Average Debt of College Graduates Kiplinger’s listed the top 100 public colleges based on many…
A: There are 4 independent samples which are New York, Virginia, California and Pennsylvania. We have…
Q: A researcher wants to study the relationship between salary and gender. She randomly selects 392…
A: The number of men is 200.
Q: A researcher wants to study the relationship between salary and gender. She randomly selects 392…
A: Given: Income Male Female Total Below $25000 48 45 93 $25000-$50000 38 36 74 $50000-$75000…
Q: Which of the following statements is TRUE? I. In multiple linear regression, there should not be any…
A: Multiple Linear Regression: In statistics, this measure is used to predict the dependent variable…
Q: The following are regression Results for Monthly Cash Flow Study Coefficients Standard Error…
A: Solution: The output for the time series model is given.
Q: Suppose a university has 10,000 computers on the campus, which are susceptible if confronted with a…
A:
Q: In a random sample of 18 people, the mean commute time to work was 33.7 minutes and the standard…
A:
Q: Activity 2 A. Find the value of p. 1. n = 160 X = 40 2. n = 90 x = 45 3. n = 200 x = 50 4. n = 720 x…
A:
Q: A hypothesis test was conducted to investigate whether the population mean age of college students…
A:
Q: (DEPENDANT ON or INDEPENDANT OF?) the age of the person taking the pill. (CLAIM OR NOT CLAIM?) 2.…
A:
Q: C. Given the null and alternative hypotheses in synibol, determine the hypothesis test used…
A: From the above table 1) Hypothesis H0 : μ = 25 H1 : μ < 25 Hypothesis test used Left talied…
Q: population of a certain species can be modeled with the following equation: N= 1+300 e -0.7t' mplete…
A: The equation is N=300001+300e-0.7t where t is the number of years and N is the population
Q: B. Find the margin error that corresponds to the given statistics and confidence level. n = 150, p =…
A:
Q: Explain this plot (linear regression analysis)
A: The fitted versus residual plot is useful in checking regression assumptions.
Q: "Near Surface Characteristics of Concrete: Intrinsic Permeability," Vol. 41, 1989), presented data…
A:
Q: 2. Let (X, Y) be a vector with joint density function x+y 3 fx,y (x, y) = (2) 1(0,1,2,3,...) (y)…
A: Disclaimer: " Since, you have asked a question with more than three sub parts, but we can only…
Q: Consider the relationship between the number of bids an item on eBay received and the item's selling…
A: The independent variable is Price in dollars. The dependent variable is Number of Bids. We have to…
Q: Wilson Publishing Company produces books for the retail market. Demand for a current book is…
A: Since you have posted multiple questions, as per our guidelines we have provided answer for first 3…
Step by step
Solved in 3 steps with 3 images
- 37 - The more than cumulative series graph of a classified frequency series is given below. What is the standard deviation value of the classified series?A) 44.39B) 44.16C) 43.61D) 45.42E) 43.17Question 6 A researcher wishes to test the claim that on average more juvenile than adults are classified as missing persons. Records of the last five years are shown. At α = 0.05 is there sufficient evidence to support the claim? Juveniles: 65,513 65,934 64,213 61,954 59,167 Adults: 31, 364 34,478 36,937 35,946 38,209 a. Formally state (write in symbols) the hypotheses b. Is this a univariate or a bivariate analysis? Can you state it in terms of dependent and independent variables? Using the Computer printout below answer the following question: c. What is standard error of the difference under the assumption of variance equality? __________ ___________ d. What is the value of the t statistic under the assumption of equality of variances. e. What is the value of difference between the means under the assumption of equality of…The Power Series
- QUESTION 8 You may need to use the appropriate appendix table or technology to answer this question. Consider a binomial experiment with n = 20 and p = 0.70. (Round your answers to four decimal places.) (a) Compute f(12). f(12) = (b) Compute f(16). f(16) = (c) Compute P(x ≥ 16). P(x ≥ 16) = (d) Compute P(x ≤ 15). P(x ≤ 15) = (e) Compute E(x). E(x) = (f) Compute Var(x) and σ. Var(x) =σ=24 - Arithmetic mean of the grouped grade series ? = 3.52 points andstandard deviation σ = 1.6 points. On the other hand, since the Group Mode M o = 3.6 points, calculate a measure of (Pearson) asymmetry based on averages.A) -0.73 B) -0,05 C) 0.05 D) -3.3 E) 4.8Which one of the following components represents the basic tendency of the series? a. Secular Trend b. Seasonal Variations c. Cyclic Variations d. Irregular Variations
- For “weekly number of Covid-19 patients for your local area over the past 2 years”, what sort of time pattern(s) would you expect to see? Draw an imaginary time series plot for this variable and explain the patterns you expect by giving your reason.In regression analysis, F-statistics indicates; a. Overall fitness of the model b. Stationarity of the data series c. Stability of the coefficients d. None of the above1.4 refers to Macraurin’s series