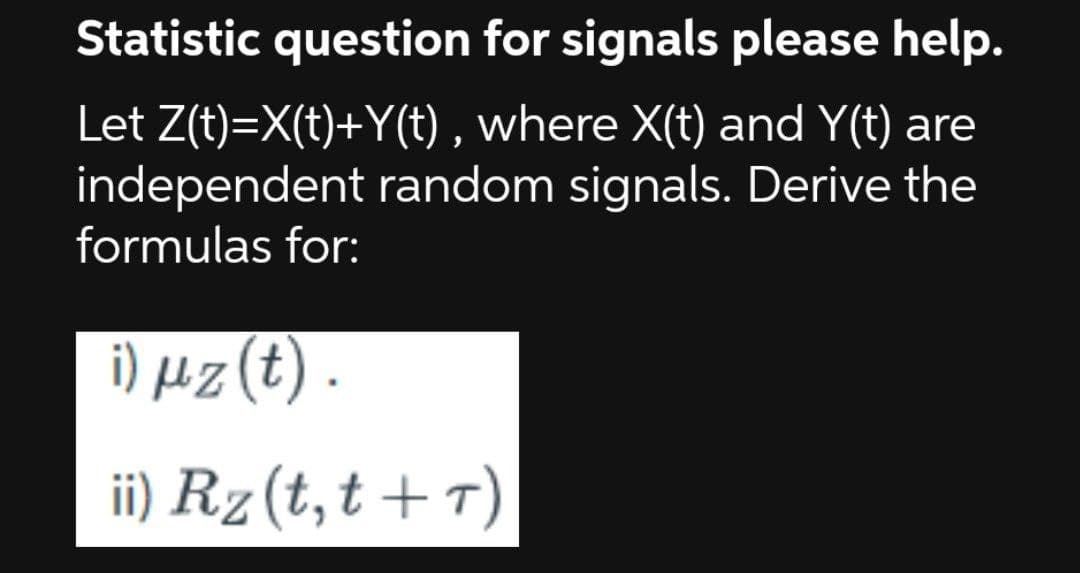
Statistic question for signals please help. Let Z(t)=X(t)+Y(t), where X(t) and Y(t) are independent random signals. Derive the formulas for: i) uz (t). ii) Rz (t, t+T)


Q: Sodium Contents of Foods The amount of sodium (in milligrams) in one serving for a random sample of…
A: There are 3 independent samples which are Condiments, Cereals, and Desserts. We have to test whether…
Q: Let’s suppose that you have the following specification: yt=B0+B1xt+ut where ut might be…
A:
Q: Find the indicated area under the standard normal curve. To the right of z= 0.27 Click here to view…
A: We need to find the area right of z=0.27.
Q: Data Set I 106 Data Set II 106 85 100 Data Set III 106 85 100 105 123 123 90 84 123 90 84 77 89 89…
A:
Q: You estimated the following regression. What value would you predict for Y, if X = 88? (Round your…
A: The independent variable is X. The dependent variable is Y. We have to predict Y if X = 88.
Q: The probability density function for a continuous random variable X has the form, Find the…
A:
Q: Sodium Contents of Foods The amount of sodium (in milligrams) in one serving for a random sample of…
A:
Q: Kiara sets up a passcode on her smart phone, which allows for 7 digits. She was informed that using…
A: Given: A smartphone allows 7 digits password she is a digit twice makes the phone more secure.
Q: Which of the following is the estimated regression line?
A: From the given output, Y-intercept a = 104.8311 And slope b = 35.48969
Q: For a medical study, a researcher wishes to select people in the middle 60% of the population based…
A:
Q: Employee Absences A store manager wishes to see if the number of absences of her employees is the…
A: Given Alpha=0.01
Q: Let Z be a random variable with the standard normal distribution. Find P(-1.35 ≤ Z≤ 2.15) P(0.55 ≤Z≤…
A: We have to find value of standard normal table
Q: Do a T test and interpret the results from the data and graph in the attached images
A: Given information: The data represents the values of the variables crushed walnuts and uncrushed…
Q: A continuous random variable X which can assume between x = 2 and 8 inclusive has a density function…
A:
Q: A report states the average temperature for a region in the summer months is 66 degrees F. A…
A: Givensample size(n)=16Mean(x)=68standard deviation(s)=4.9α=0.05
Q: find the null and alternative hypotheses and what kind of test it is B. Find the P-value C.…
A: Hypothesis H0 : P1= P2 H1 : P1 ≠ P2 This is two tailed z test
Q: 0.695 0.873 1.083 1.356 1.782 0.694 0.87 1.079 1.35 1.771 0.692 0.868 1.076 1.345 1.761 0.691 0.866…
A:
Q: Given P(A and B) = 0.94, P(A) = 0.98, and P(B) = 0.96 are events A and B independent or dependent?
A: Here Given P(A)=0.98 P(B)=0.96 P(A and B)=0.94
Q: Which of the required conditions for cause and effect is easiest to establish in nonexperimental…
A: Let's define non-experimental research before answering this question where we do not conduct an…
Q: Listed below are the lead concentrations (in µg/g) measured in different Ayurveda medicines.…
A: Given data is2.97,6.52,5.97,5.54,20.50,7.48,12.01,20.49,11.53,17.52sample size(n)=10
Q: In a study of cell phone usage and brain hemispheric dominance, an Internet survey was e-mailed to…
A:
Q: .A gas station wants to compare a group of consumers' overall perceptions of service with overall…
A: Test Statistic A test statistic is a value derived from a statistical hypothesis test. It evaluates…
Q: Given P(A and B) = 0.07, P(A) = 0.75, and P(B) = 0.63 are events A and B independent or dependent?…
A:
Q: The national distribution of scores on the Advanced Placement (AP) examination in statistics (out of…
A: The chi square test statistic is 38.4.
Q: Thanksgiving Travel According to the American Automobile Association, 31 million Americans travel…
A: For the given data Perform Chi square test
Q: Suppose you roll a special 39-sided die. What is the probability that one of the following numbers…
A: if we roll a special 39-sided die than the possibleout comes are 39
Q: 2. A study is undertaken to determine the proportion of industry executives who believe that…
A: Let us assume sample proportion(p^)=0.51-p^=1-0.5=0.5α=1-0.99=0.01α2=0.005Z0.005=2.58 (from…
Q: eloped the following supply, demand, cost, and inventory data. Supply Available Regular Time…
A:
Q: Scores on the GRE (Graduate Record Examination) are normally distributed with a mean of 576 and a…
A: The random variable test score follows normal distribution. We have to find the percentage of people…
Q: Given two independent random samples with the following results: n1=297pˆ1=0.67n1=297p^1=0.67…
A: We have given that, p̂1 = 0.67, n1 = 297 And p̂2 = 0.41, n2 = 93 Then, We will find the 98%…
Q: Living with parents: The Pew Research Center reported that 36% of American Millennials (adults ages…
A: Given information: The sample was collected from the population of American Millennials still live…
Q: A personnel director in a particular state claims that the mean annual income is greater in one of…
A:
Q: 1. P37 2. P73 3. P29 MAL
A: Here's the percentile will find by normal probability curve at 37, 73 and 29.
Q: 1. The number of grade 11 students of 32 schools in Benguet selected at random are given below.…
A: Given: Sample size, n=32 Population sd, σ=165.1confidence level=95% No. of students, X 211…
Q: Find the indicated area under the standard normal curve. To the right of z = 0.64 Click here to view…
A:
Q: Find the critical values of χ2 based upon the given information below. Show work. Claim: σ ≠…
A: It is given that Sample size n = 28 Level of significance = 0.05 Test : two-tailed. Note : Since you…
Q: A sample of weights (in pounds) for six 12-year-olds is given below: 97 75 91 83 80 96 Find…
A:
Q: Correlation Results Fifty-four wild bears were anesthetized, and then their weights and chest sizes…
A: Given that Correlation r = 0.964257 Critical value = ± 0.2680855 The null and alternative…
Q: Consider the hypotheses shown below. Given that x = 106, a=26, n=41, a=0.10, complete parts a and b.…
A:
Q: Given a standardized normal distribution (with a mean of 0 and a standard deviation of 1), determine…
A: We will use Std. Normal table to find the required probabilities. Note : According to our guidelines…
Q: Is the following results section correct? A single sample t test was conducted to measure the…
A: Given the spss output of one sample T test
Q: What is the reason that ignoring the multicolinearity can be problematic when we con- struct a MLR…
A:
Q: 1. Express the null hypothesis, H0 and the alternative hypothesis, H1 in symbolic form. Use the…
A: 1)GivenCarter Motor Company claims that its new sedan, the Libra, will average better than 30 miles…
Q: is there seasonality? interpret the decomposed plot
A: Seasonal Decomposition: In time series analysis, seasonal decomposition is a method used to…
Q: There are 100,000 students, staff, and faculty with an account at ASU, and when the virus was…
A: Given: There are 100,000 students, staff, and faculty with an account at ASU, and when the virus was…
Q: An exclusive college desires to accept only the top 10% of all graduating seniors on the basis of…
A:
Q: The annual per capita consumption of bottled water was 31.1 gallons. Assume that the per capita…
A: Let X denote the consumption of bottled water. Given that X follows N(mean = 31.1, SD = 11), then Z…
Q: Assume that a procedure yields a binomial distribution with a trial repeated n = 7 times. Find the…
A:
Q: What are p-values? Some people claim that a p- value is the probability of getting a result from a…
A: According to Sir Ronald Fisher "The null hypothesis is a statistical hypothesis tested for the…
Q: In a sample of 44 water specimens taken from a construction site, 27 contained detectable levels of…
A:

Step by step
Solved in 2 steps with 2 images

- continuous random variables Z is known to have an Erlang (2,1.3) type PDF. what is the variance of Z ?Let Y1, . . . , YN be a random sample from the Normal distribution Yi ∼ N(ln β, s2) where s^2is known.Find the maximum likelihood estimator of b from first principles.Find the Score function, the estimating equation and the information matrix using GLMLet X and Y be jointly distributed random variables. This exercise leads you through a proof of the fact that −1 ≤ ρX,Y ≤ 1. a) Express the quantity V(X − (σX/σY)Y) in terms of σX, σY, and Cov(X, Y). b) Use the fact that V(X − (σX/σY)Y) ≥ 0 and Cov(X, Y) = ρX,YσXσY to show that ρX,Y ≤ 1. c) Repeat parts (a) and (b) using V(X + (σX/σY)Y) to show that ρX,Y ≥ −1.
- U is a uniform (0, 1) random variable and X = −ln(1 − U). Find the PDF, CDF of randomvariable X. Calculate the expected value of X.Suppose X and Y are continuous random variables such that the pdf is f(x,y)=x+y with 0≤x≤1,0≤y≤1. a)Draw a graph that illustrates the domain of this pdf. b)Find the marginal pdfs of X and Y.c)Compute ux,ux,var x,var y, cov(x,y) ,and pd (Rho d)) Determine the equation of the least squares regression line and draw it on your graph.Exercise 4.3 Two measurement methods are used to evaluate the surface smoothness of a paper product. Let X and Y denote the measurements of each of the two methods. Suppose that the joint p.d.f of X and Y is modeled by fxy (x, y) = c, 0 <x <4, 0<y and x-1 < y <x+1 Determine the value of c. Determine the marginal probability distribution of X. Find also the mean and variance of X. Determine the conditional probability distribution of Y given X=2. Find also the conditional mean and conditional variance of Y given X=2 Check if the measurements of the two methods X and Y are independent. * SHOW COMPLETE SOLUTION WITH GIVEN, REQUIRED, AND SOLUTION. SHOW TABLE OF ILLUSTRATIONS IF NECESSARY.
- b) Let Y1, Y2, ..., Yn be a random sample from a population with probability density function in part a). Show that the best test for the hypothesis in part a) rejects Ho if |yi <c i=1 where c solves the probability equation a = P(II1Yis c[0 = 2). c) Let X1,X2, ..., Xn be a random sample from GAMMA(2,ß) distribution, and consider Y = E-,Xi- Show whether or not Y is a pivotal quantity and give its distribution.X is a discrete uniform (1,3) random variable. When X=x, Y is discrete uniform (1,x). (a) Find the correlation of X and Y (b) Find the mean value of X when Y=2.Solve using the moment-generating function technique. Let X1, . . . , Xn be independent random variables, such that Xi ∼ N(µi, σ2) for i = 1, . . . , n. Find the distribution of Y = a1X1 + · · · + anXn.
- Let X and Y be continuous random variables with joint distribution function, F (x,y). Let g (X,Y) and h (X,Y) be functions of X and Y. PROVE Cov (X,Y) = E[XY] - E[X] E[Y]Two archers will simultaneously shoot once at a target. Let Xi , i = 1, 2, be marksman i's horizontal error, measured in meters. If the target's position is (a, b), and marksman i's shot ends up at (x, y), then Xi = (x - a). These errors are modeled by X1 ~ N(0, 0.5) and X2 ~ N(0, 1). What is the probability that both shots will be within 1 meter of the target, in the horizontal direction?Exercise 2: Let X be a random density variable f(x) = { e−2θx if x ≥ 0 0 else Find θ so that f is a probability density. Determine the distribution function F of the variable X. Calculate the expectation and variance of X. Let Y be the random variable defined by Y = θX. What is the law of Y?
