Example 9. Present the data given below by rectangle diagram. No. of Students Humanities 2010-11 2011-12 2012-13 Science 170 220 300 280 310 360 Commerce 150 270 340 Total 600 800 1000
Example 9. Present the data given below by rectangle diagram. No. of Students Humanities 2010-11 2011-12 2012-13 Science 170 220 300 280 310 360 Commerce 150 270 340 Total 600 800 1000

Big Ideas Math A Bridge To Success Algebra 1: Student Edition 2015
1st Edition
ISBN:9781680331141
Author:HOUGHTON MIFFLIN HARCOURT
Publisher:HOUGHTON MIFFLIN HARCOURT
Chapter4: Writing Linear Equations
Section: Chapter Questions
Problem 14CR

Related questions
Question
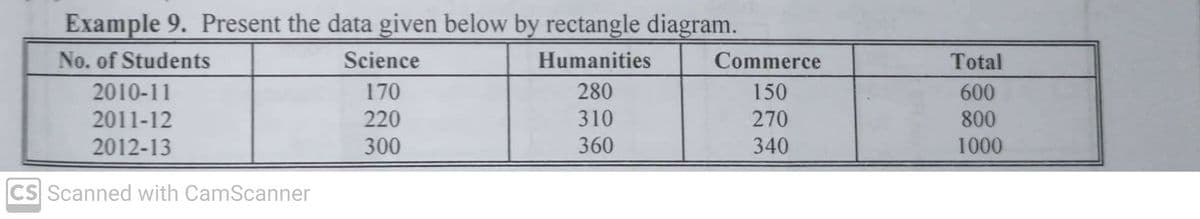
Transcribed Image Text:Example 9. Present the data given below by rectangle diagram.
No. of Students
Humanities
280
310
360
2010-11
2011-12
2012-13
CS Scanned with CamScanner
Science
170
220
300
Commerce
150
270
340
Total
600
800
1000
Expert Solution
This question has been solved!
Explore an expertly crafted, step-by-step solution for a thorough understanding of key concepts.

Step by step
Solved in 2 steps with 2 images

Recommended textbooks for you
Big Ideas Math A Bridge To Success Algebra 1: Stu…
Algebra
ISBN:
9781680331141
Author:
HOUGHTON MIFFLIN HARCOURT
Publisher:
Houghton Mifflin Harcourt

Functions and Change: A Modeling Approach to Coll…
Algebra
ISBN:
9781337111348
Author:
Bruce Crauder, Benny Evans, Alan Noell
Publisher:
Cengage Learning
Big Ideas Math A Bridge To Success Algebra 1: Stu…
Algebra
ISBN:
9781680331141
Author:
HOUGHTON MIFFLIN HARCOURT
Publisher:
Houghton Mifflin Harcourt
Functions and Change: A Modeling Approach to Coll…
Algebra
ISBN:
9781337111348
Author:
Bruce Crauder, Benny Evans, Alan Noell
Publisher:
Cengage Learning