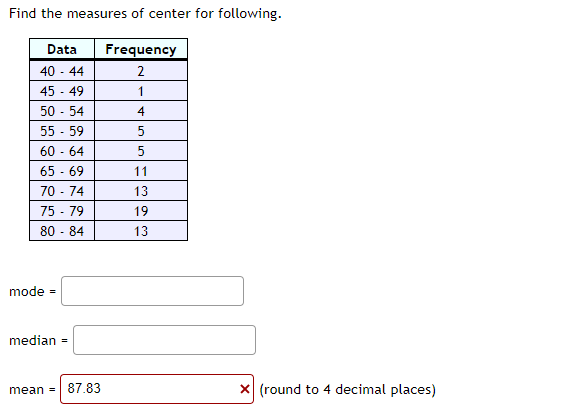
Find the measures of center for following. Frequency 2 1 4 5 Data 40 - 44 45-49 50 - 54 55-59 60 - 64 65-69 70 - 74 75-79 80 - 84 mode= median = mean - 87.83 5 11 13 19 13 X (round to 4 decimal places)


Q: Office of Coal, Nuclear, Electric and Alternate Fuels reported the owing data as the costs (in…
A: Hi! Thank you for the question, As per the honor code, we are allowed to answer three sub-parts at a…
Q: ata was collected on 500 high school students to help determine which factors are associated with…
A: Quantitative data: Quantitative data is the value of data in the form of counts or numbers. Here…
Q: A friend of mine is giving a dinner party. His current wine supply includes 9 bottles of zinfandel,…
A: As per our guidelines we are suppose to answer only three sub parts. Given,no.of zinfandel…
Q: The following are ages in years of nine employees of a large company. 46, 22, 35, 26, 22, 53, 33,…
A: Given that x x2 46 2116 22 484 35 1225 26 676 22 484 53 2809 33 1089 42 1764…
Q: Let A and B have the joint probability density function f(a,b) = 6(1-a - b) for a+b 0, b>0 and it is…
A: Given that, A and B have joint pdf: f(a,b)= 6(1-a-b) , a+b>1, a>0, b>0
Q: 60 randomly selected students were asked the number of pairs of shoes they have. Let X represent the…
A:
Q: Find the 64th percentile, P64, from the following data 2 3 4 6 10 11 12 14 16 18 20 35 37 42 56 62…
A: Data given 2,3,4,6,10,11,12,14,16,18,20,35,37,42,56,62,67,73,76,77,78,87,95
Q: True or False: If you are asked to describe the type of data represented by distances from gas…
A: Given that The type of data represented by distances from gas stations to your home
Q: c. Let X denote a random variable with mean 4 and variance 2.5. If Y = 2X, calculate the mean and…
A: For a defined random variable Z, and a constant a, using the properties of expectation (or mean), it…
Q: In a survey of 1398 people, 987 people said they voted in a recent presidential election. Voting…
A: Answer: From the given data, sample size (n) = 1398 number of People voted = x = 987 Population…
Q: (a) If you draw 5 cards, one at a time, placing each card back into the deck and shuffling before…
A: Here given , An iteration of the board game Candyland has the following cards: 6 each of red,…
Q: A statistician selects a sample of 20 participants and makes the decision to retain the null…
A: Given : Sample of 20 participants led to retain the null hypothesis Sample 100 participants led to…
Q: 0 A.; B.; or C. ? Z-distribution = 130 (approximately) A B C 2 3 Consider the figure above. A…
A: Sample size refers to how many people or subjects were involved in a statistical experiment. The…
Q: A statistics class has been given the task of collecting data on the age of customers for a food…
A: Standard deviation is a measure of dispersion of a data set. It measures the amount of variation in…
Q: The accompanying data are lengths (inches) of bears. Find the percentile corresponding to 68.0 in.…
A: Data is given We have to calculate Percentile corresponding to 68.0 In data, 68.0 is at 43rd…
Q: 5 10 + 15 20 25 30 data Number 40 24 42 10 16 35 40 45 Based on the box plot above, determine which…
A:
Q: The following data represent the number of people aged 25 to 64 years covered by health insurance…
A: The data shows the number of people aged 25 to 64 years covered by health insurance in 2018.
Q: Are all employees equally proven to having accidents? To investigate this hypothesis, Parry (1985)…
A: Null Hypothesis: H0: The age and accident type are independent. Alternative Hypothesis: H1: The age…
Q: The Pearson correlation coefficient between two variables (education and income) is .354. Answer the…
A:
Q: Determine the Frequency of the 1049-1118 Firth class 1119-1188 1189-1258 1259-1328 1329-1398…
A: From the provided information, The frequency class are as follow: Class 1049 - 1118 1119-1188…
Q: Estimate p-value using the following randomization distribution for a correlation between two…
A:
Q: 2 ΣΕ 1 Χ. B 98% Confidence interval for ß if a random sample is given by 2.4, 4.6, 3.3, 3.1, 4.6,…
A: A quantity is said to be pivotal quantity if it's distribution is free from parameter.
Q: # of Movies 0 1 2 3 4 5 Frequency 4 5 3 5 4 5 The first quartile : The third quartile: What…
A: The given data is a s follows: # of movies Frequency 0 4 1 5 2 3 3 5 4 4 5 5
Q: The dot plot represents the distribution of wages earned during a one-week period by 12 college…
A: Given information: Score for the 12 students shown in dot plot are: 112, 113, 116, 116, 116, 118,…
Q: Ester and George want to make soup. In order to get the right balance of ingredients for their…
A: It is given that 2 pounds of potatoes were bought for $4.84 per pound. 4 pounds of cod were bought…
Q: An automobile manufacturer decides to carry out a fuel efficiency test to determine if it can…
A: Data given For previous model n1=6, s1=1.41, sample mean x̄1=29.5 For new model n2=6, s2=1.25,…
Q: Find the indicated z score. The graph depicts the standard normal distribution with mean 0 and…
A: Answer: From the given data, The distribution is standard normal with mean 0 and standard deviation…
Q: The Mathematics section of the ACT test had a mean of 20.9 and an SD of 5.3 for the years 2013-2015.…
A: given data normal distributionμ = 20.9 σ = 5.3we have to solve (b) % of data scored under 17 = ?
Q: True or False: The closer the correlation coefficient, r, is to zero, the weaker the linear…
A: We have to interpret the values of correlation coefficient r
Q: of people have type O or Rh- factor. Round all decimals to 4 places where possible. (a) Find the…
A: Given that P(Type O) = 38% = 0.38 P(Rh-Factor) = 10% = 0.10 P(Type O or Rh-factor) = 46% = 0.46
Q: Required information A process that manufactures piston rings produces rings whose diameters (in…
A: Given: The given probability distribution function is given: f(x) =…
Q: An experiment investigated the effect of length and repetition of TV ads on students choosing to eat…
A: Experiment is the study used to understand the population. It involves some treatments or technique…
Q: 2) Suppose that X is a random variable having a probability density function xét, x>0 ((3²) ₁ - + xe…
A: The probability density function (PDF) of X is specified as follows: fXx;β=1β2xe-xβ,…
Q: For the distribution shown, which letter represents the mode? (This is a reading assessment…
A: We know This graph consist 2 axis( x and y) Three measures ( mean, median, mode) X- axis represent…
Q: True or False: A very strong correlation between two variables means that one variable causes the…
A: It is given that the statement about to the correlation between the two variables. Here, need to…
Q: 63 68 65 79 95 79 77 98 61 80 79 78 64 87 83 64 74 78 79 92 85 71 79 77 79 87 62 67 71 76 You are…
A: Here, Stem values are the face values of the digits in tenth place. Leaf values are the face values…
Q: and
A: Response variable : It is also referred to as an outcome or a dependent variable. In simple words,…
Q: The object of a general chemistry experiment is to determine the amount (in millilitres [mL]) of…
A:
Q: 7. Suppose you order a new pair of swimming goggles and that they will be manufactured with a defect…
A:
Q: (a) Compute the z-score corresponding to the individual who obtained 40.2 miles per gallon.…
A: “Since you have posted a question with multiple sub-parts, we will solve first three subparts for…
Q: In a certain city, the average 20- to 29-year old man is 72.5 inches tall, with a standard deviation…
A: Given: For men: Mean μ = 72.5 Standard deviation σ = 3.2 For women: Mean μ = 64.3 Standard deviation…
Q: Benjamin owns a small Internet business. Besides himself, he employs nine other people. The salaries…
A:
Q: The correlation coefficient between the variables x and y is r=0.78 . If Sigma x=1.56, Sigma…
A:
Q: The electric power consumed each month by a chemical plant is thought to be related to the average…
A: Hint: Use excel to solve multiple linear regression.
Q: Let X be a random variable which represents the lifetime in years of a particular battery. We are…
A: Given: X follows exponential distribution λ=0.15 Asper guidelines only first three subparts has…
Q: t X be a random variable which represents the lifetime in years of a particular battery. We are…
A: Given: X is lifetime in years of a battery X ~ Exp λ=0.15 Let a denote 99 percentile. P(X < a )=…
Q: ts, and the distribution of total study hours per week is bell-shaped with a mean of 14 hours and a…
A: The total study hours per week has mean of 14 and standard deviation of 3.1 hours. μ=14σ=3.1
Q: Please use the accompanying Excel data set or accompanying Text file data set when completing the…
A: Given information: 424, 431, 415, 418, 422, 437, 419, 409, 430, 430, 422, 426, 410, 436, 435, 431,…
Q: McDonald's conducted research about the proportion of their egg muffin buyers who also order a cup…
A:
Q: The weights of students are normally distributed with mean 58 and standard deviation 2.4. For a…
A: Answer: Using the given data, Population mean = μ = 58 Population standard deviation = σ = 2.4

Step by step
Solved in 5 steps
