example, large if it is describing the varlablity from store to store in the price of an ice cube tray. On the other hand, a Standard deviation of $1 would be considered small if it is describing store-to-store variability in the price of a particular brand of freezer. A quantity designed to give a relative measure of variability is the coefficient of variation. Denoted by CV, the coefficient of variation expresses the standard deviation as a percentage of the mean. It is defined by the following formula. CV = 100(s/x) Consider two samples. Sample 1 gives the actual weight (in ounces) of the contents of cans of pet food labeled as having a net weight of 8 ounces. Sample 2 gives the actual weight (in pounds) of the contents of bags of dry pet food labeled as having net weight of 50 pounds. The weights for the two samples are as follows. 8.9| 7.7 7.3 8.9 7.3 Sample 1 7.3 7.5 8.9 8.4 7.3 51.5 50.6 53.0 50.4 50.8 Sample 2 47.0 50.4 50.3 48.7 48.2 In USE SALT (a) For each of the given samples, calculate the mean and the standard deviation. (Round your standard deviations to four decimal places.) Sample 1 7.95 0.5406 Mean Standard Deviation Sample 2 50.0667 x 1.8188 X Mean Standard Deviation (b) Calculate the coefficient of variation for each sample. (Round your answers to two decimal places.) cv, 9.25 CV, 3.63 Need Help? Read it
example, large if it is describing the varlablity from store to store in the price of an ice cube tray. On the other hand, a Standard deviation of $1 would be considered small if it is describing store-to-store variability in the price of a particular brand of freezer. A quantity designed to give a relative measure of variability is the coefficient of variation. Denoted by CV, the coefficient of variation expresses the standard deviation as a percentage of the mean. It is defined by the following formula. CV = 100(s/x) Consider two samples. Sample 1 gives the actual weight (in ounces) of the contents of cans of pet food labeled as having a net weight of 8 ounces. Sample 2 gives the actual weight (in pounds) of the contents of bags of dry pet food labeled as having net weight of 50 pounds. The weights for the two samples are as follows. 8.9| 7.7 7.3 8.9 7.3 Sample 1 7.3 7.5 8.9 8.4 7.3 51.5 50.6 53.0 50.4 50.8 Sample 2 47.0 50.4 50.3 48.7 48.2 In USE SALT (a) For each of the given samples, calculate the mean and the standard deviation. (Round your standard deviations to four decimal places.) Sample 1 7.95 0.5406 Mean Standard Deviation Sample 2 50.0667 x 1.8188 X Mean Standard Deviation (b) Calculate the coefficient of variation for each sample. (Round your answers to two decimal places.) cv, 9.25 CV, 3.63 Need Help? Read it

MATLAB: An Introduction with Applications
6th Edition
ISBN:9781119256830
Author:Amos Gilat
Publisher:Amos Gilat
Chapter1: Starting With Matlab
Section: Chapter Questions
Problem 1P

Related questions
Question
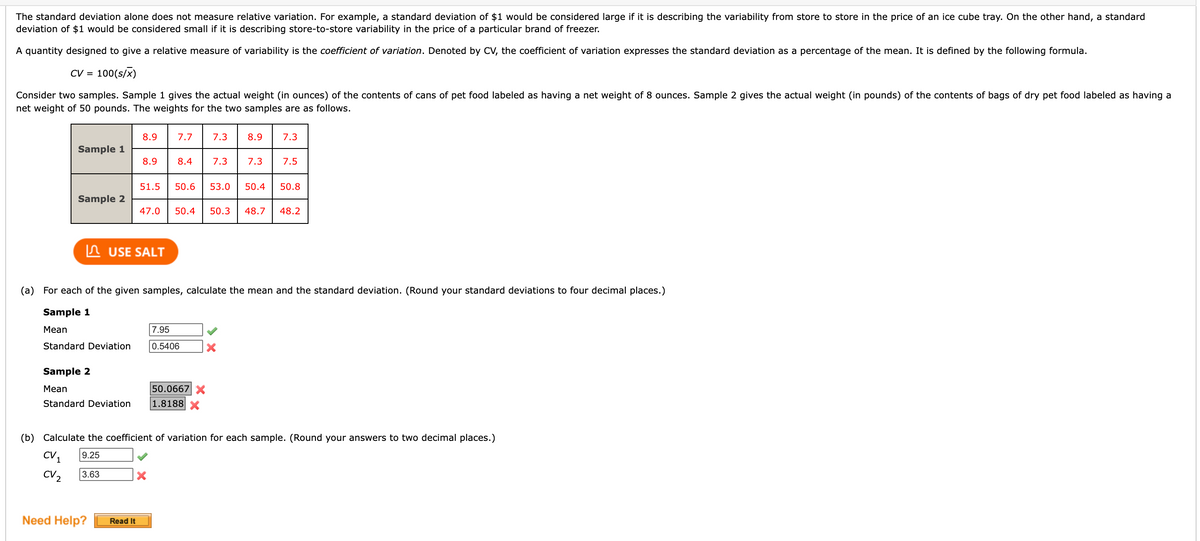
Transcribed Image Text:The standard deviation alone does not measure relative variation. For example, a standard deviation of $1 would be considered large if it is describing the variability from store to store in the price of an ice cube tray. On the other hand, a standard
deviation of $1 would be considered small if it is describing store-to-store variability in the price of a particular brand of freezer.
A quantity designed to give a relative measure of variability is the coefficient of variation. Denoted by CV, the coefficient of variation expresses the standard deviation as a percentage of the mean. It is defined by the following formula.
CV = 100(s/x)
Consider two samples. Sample 1 gives the actual weight (in ounces) of the contents of cans of pet food labeled as having a net weight of 8 ounces. Sample 2 gives the actual weight (in pounds) of the contents of bags of dry pet food labeled as having a
net weight of 50 pounds. The weights for the two samples are as follows.
8.9
7.7
7.3
8.9
7.3
Sample 1
8.9
8.4
7.3
7.3
7.5
51.5
50.6
53.0
50.4
50.8
Sample 2
47.0
50.4
50.3
48.7
48.2
In USE SALT
(a) For each of the given samples, calculate the mean and the standard deviation. (Round your standard deviations to four decimal places.)
Sample 1
Mean
7.95
Standard Deviation
0.5406
Sample 2
Mean
50.0667X
Standard Deviation
|1.8188
(b) Calculate the coefficient of variation for each sample. (Round your answers to two decimal places.)
CV
9.25
CV2
3.63
Need Help?
Read It
Expert Solution
This question has been solved!
Explore an expertly crafted, step-by-step solution for a thorough understanding of key concepts.

This is a popular solution!

Trending now
This is a popular solution!

Step by step
Solved in 3 steps with 3 images

Recommended textbooks for you
MATLAB: An Introduction with Applications
Statistics
ISBN:
9781119256830
Author:
Amos Gilat
Publisher:
John Wiley & Sons Inc

Probability and Statistics for Engineering and th…
Statistics
ISBN:
9781305251809
Author:
Jay L. Devore
Publisher:
Cengage Learning

Statistics for The Behavioral Sciences (MindTap C…
Statistics
ISBN:
9781305504912
Author:
Frederick J Gravetter, Larry B. Wallnau
Publisher:
Cengage Learning
MATLAB: An Introduction with Applications
Statistics
ISBN:
9781119256830
Author:
Amos Gilat
Publisher:
John Wiley & Sons Inc
Probability and Statistics for Engineering and th…
Statistics
ISBN:
9781305251809
Author:
Jay L. Devore
Publisher:
Cengage Learning
Statistics for The Behavioral Sciences (MindTap C…
Statistics
ISBN:
9781305504912
Author:
Frederick J Gravetter, Larry B. Wallnau
Publisher:
Cengage Learning

Elementary Statistics: Picturing the World (7th E…
Statistics
ISBN:
9780134683416
Author:
Ron Larson, Betsy Farber
Publisher:
PEARSON

The Basic Practice of Statistics
Statistics
ISBN:
9781319042578
Author:
David S. Moore, William I. Notz, Michael A. Fligner
Publisher:
W. H. Freeman

Introduction to the Practice of Statistics
Statistics
ISBN:
9781319013387
Author:
David S. Moore, George P. McCabe, Bruce A. Craig
Publisher:
W. H. Freeman