Executives at The Thinking Channel have decided to test whether the educational backgrounds of the channel's viewers are different from the educational backgrounds of American adults (ages 25 and over) as a whole. The executives have the following information on the American adult population as a whole, obtained from a recent U.S. Current Population Survey. Highest degree earned Percent of population Less than high school (fo-JE)² JE 12% High school 25% College Higher than college (Observed frequency - Expected frequency)² Expected frequency 55% The executives also obtained data (from telephone surveys) on highest degrees earned for a random sample of 160 American adults who are Thinking Channel viewers. These data are summarized by the first row of numbers in the table below. These numbers are the frequencies for the degree categories that were observed in the sample of 160. The second row of numbers gives the expected frequencies under the assumption that the distribution of highest degrees earned by Thinking Channel viewers is the same as the distribution of highest degrees earned by American adults as a whole. The bottom row of numbers gives the following value for each of the degree categories. 8%
Executives at The Thinking Channel have decided to test whether the educational backgrounds of the channel's viewers are different from the educational backgrounds of American adults (ages 25 and over) as a whole. The executives have the following information on the American adult population as a whole, obtained from a recent U.S. Current Population Survey. Highest degree earned Percent of population Less than high school (fo-JE)² JE 12% High school 25% College Higher than college (Observed frequency - Expected frequency)² Expected frequency 55% The executives also obtained data (from telephone surveys) on highest degrees earned for a random sample of 160 American adults who are Thinking Channel viewers. These data are summarized by the first row of numbers in the table below. These numbers are the frequencies for the degree categories that were observed in the sample of 160. The second row of numbers gives the expected frequencies under the assumption that the distribution of highest degrees earned by Thinking Channel viewers is the same as the distribution of highest degrees earned by American adults as a whole. The bottom row of numbers gives the following value for each of the degree categories. 8%

Glencoe Algebra 1, Student Edition, 9780079039897, 0079039898, 2018
18th Edition
ISBN:9780079039897
Author:Carter
Publisher:Carter
Chapter10: Statistics
Section10.6: Summarizing Categorical Data
Problem 10CYU

Related questions
Question
Executives at The Thinking Channel have decided to test whether the educational backgrounds of the channel's viewers are different from the educational backgrounds of American adults (ages 25 and over) as a whole. The executives have the following information on the American adult population as a whole, obtained from a recent U.S. Current Population Survey.
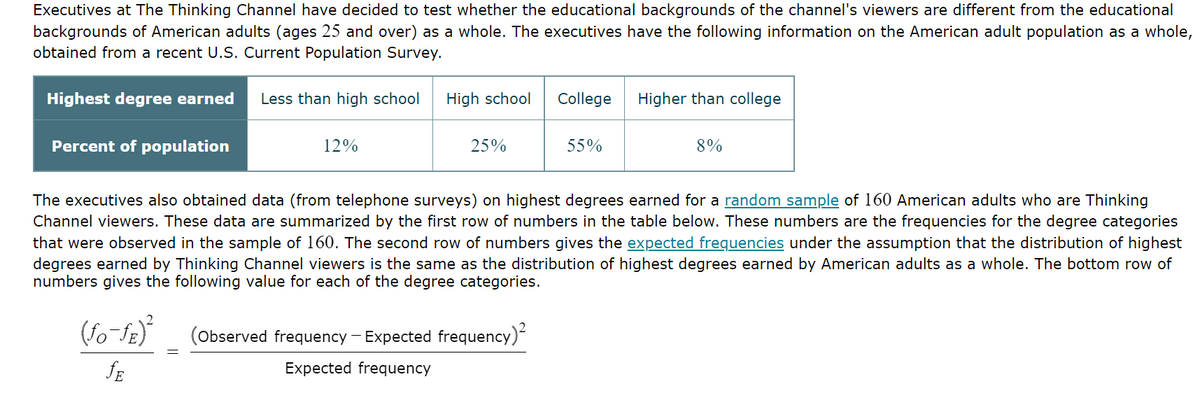
Transcribed Image Text:Executives at The Thinking Channel have decided to test whether the educational backgrounds of the channel's viewers are different from the educational
backgrounds of American adults (ages 25 and over) as a whole. The executives have the following information on the American adult population as a whole,
obtained from a recent U.S. Current Population Survey.
Highest degree earned Less than high school
Percent of population
12%
(fo-fz)²
JE
High school
25%
College Higher than college
(Observed frequency - Expected frequency)²
Expected frequency
55%
The executives also obtained data (from telephone surveys) on highest degrees earned for a random sample of 160 American adults who are Thinking
Channel viewers. These data are summarized by the first row of numbers in the table below. These numbers are the frequencies for the degree categories
that were observed in the sample of 160. The second row of numbers gives the expected frequencies under the assumption that the distribution of highest
degrees earned by Thinking Channel viewers is the same as the distribution of highest degrees earned by American adults as a whole. The bottom row of
numbers gives the following value for each of the degree categories.
8%
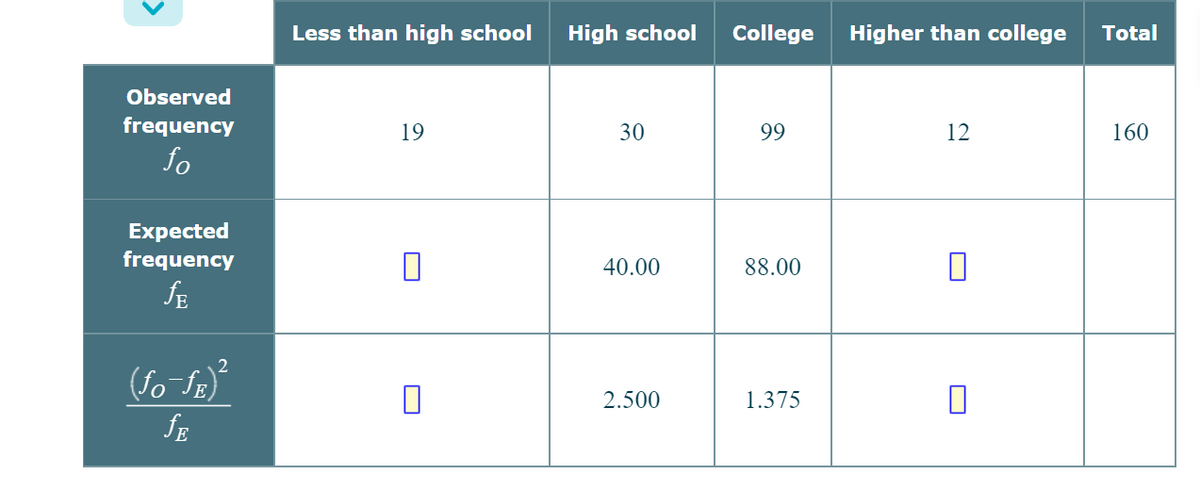
Transcribed Image Text:Observed
frequency
fo
Expected
frequency
SE
2
(ƒo¯ƒE)²
JE
Less than high school
19
High school
30
40.00
2.500
College Higher than college
99
88.00
1.375
12
Total
160
Expert Solution
This question has been solved!
Explore an expertly crafted, step-by-step solution for a thorough understanding of key concepts.

This is a popular solution!

Trending now
This is a popular solution!

Step by step
Solved in 3 steps

Recommended textbooks for you
Glencoe Algebra 1, Student Edition, 9780079039897…
Algebra
ISBN:
9780079039897
Author:
Carter
Publisher:
McGraw Hill

Holt Mcdougal Larson Pre-algebra: Student Edition…
Algebra
ISBN:
9780547587776
Author:
HOLT MCDOUGAL
Publisher:
HOLT MCDOUGAL
Glencoe Algebra 1, Student Edition, 9780079039897…
Algebra
ISBN:
9780079039897
Author:
Carter
Publisher:
McGraw Hill
Holt Mcdougal Larson Pre-algebra: Student Edition…
Algebra
ISBN:
9780547587776
Author:
HOLT MCDOUGAL
Publisher:
HOLT MCDOUGAL