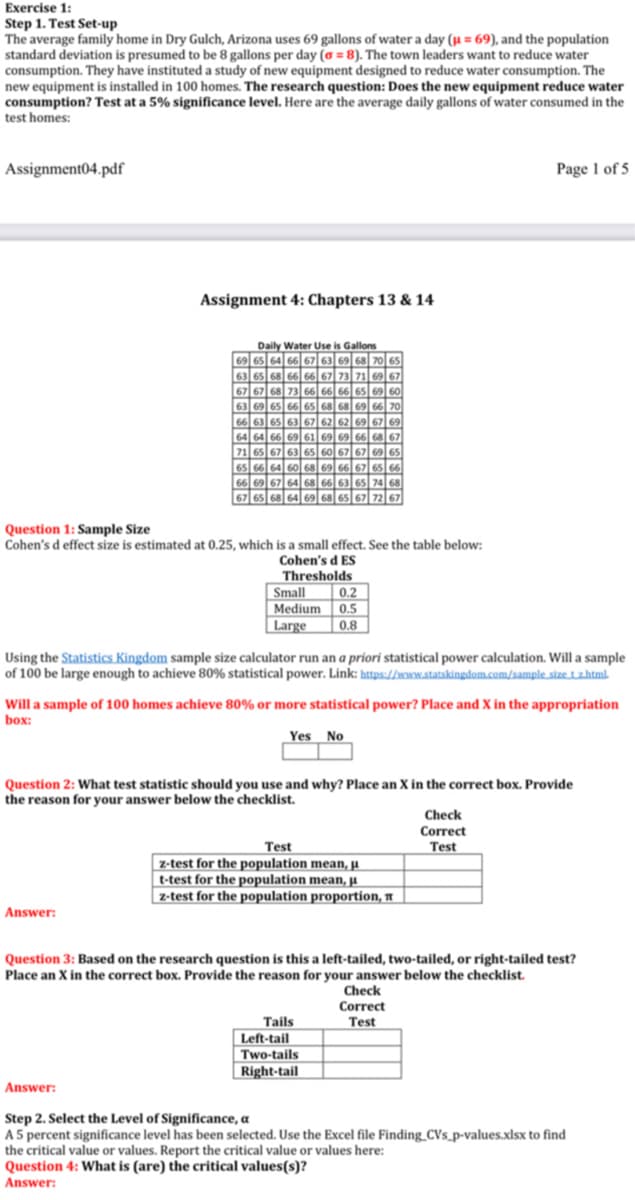
Exercise 1: Step 1. Test Set-up The average family home in Dry Gulch, Arizona uses 69 gallons of water a day (u = 69), and the population standard deviation is presumed to be 8 gallons per day (o = 8). The town leaders want to reduce water consumption. They have instituted a study of new equipment designed to reduce water consumption. The new equipment is installed in 100 homes. The research question: Does the new equipment reduce wate consumption? Test at a 5% significance level. Here are the average daily gallons of water consumed in th test homes: Assignment04.pdf Page 1 of
Exercise 1: Step 1. Test Set-up The average family home in Dry Gulch, Arizona uses 69 gallons of water a day (u = 69), and the population standard deviation is presumed to be 8 gallons per day (o = 8). The town leaders want to reduce water consumption. They have instituted a study of new equipment designed to reduce water consumption. The new equipment is installed in 100 homes. The research question: Does the new equipment reduce wate consumption? Test at a 5% significance level. Here are the average daily gallons of water consumed in th test homes: Assignment04.pdf Page 1 of

MATLAB: An Introduction with Applications
6th Edition
ISBN:9781119256830
Author:Amos Gilat
Publisher:Amos Gilat
Chapter1: Starting With Matlab
Section: Chapter Questions
Problem 1P

Related questions
Question
Can you just do number 4 and please show what are the critical values
Transcribed Image Text:Exercise 1:
Step 1. Test Set-up
The average family home in Dry Gulch, Arizona uses 69 gallons of water a day (µ = 69), and the population
standard deviation is presumed to be 8 gallons per day (a = 8). The town leaders want to reduce water
consumption. They have instituted a study of new equipment designed to reduce water consumption. The
new equipment is installed in 100 homes. The research question: Does the new equipment reduce water
consumption? Test at a 5% significance level. Here are the average daily gallons of water consumed in the
test homes:
Assignment04.pdf
Page 1 of 5
Assignment 4: Chapters 13 & 14
Daily Water Use is Gallons
69 65 64 66 67 63 69 68 70 65
63 65 68 66 66 67 73 71 69 67
67 67 68 73 66 66 66 65 69 60
63 69 65 66 65 68 68 69 66 70
66 63 65 63 67 62 62 69 67 69
64 64 66 69 61 69 69 66 68 67
71 65 67 63 65 60 67 67 69 65
65 66 64 60 68 69| 66 67 65 66
66 69 67 64 68 66 63 65 74 68
67 65 68 64 69 68 65 67 72 67
Question 1: Sample Size
Cohen's d effect size is estimated at 0.25, which is a small effect. See the table below:
Cohen's d ES
Thresholds
Small
0.2
Medium 0.5
| Large
|0.8
Using the Statistics Kingdom sample size calculator run an a priori statistical power calculation. Will a sample
of 100 be large enough to achieve 80% statistical power. Link: https://woww.statskingdom.com/sample size tzhtml-
Will a sample of 100 homes achieve 80% or more statistical power? Place and X in the appropriation
box:
Yes No
Question 2: What test statistic should you use and why? Place an X in the correct box. Provide
the reason for your answer below the checklist.
Check
Correct
Test
z-test for the population mean, H
t-test for the population mean, A
|z-test for the population proportion, A
Test
Answer:
Question 3: Based on the research question is this a left-tailed, two-tailed, or right-tailed test?
Place an X in the correct box. Provide the reason for your answer below the checklist.
Check
Correct
Tails
Test
Left-tail
Two-tails
Right-tail
Answer:
Step 2. Select the Level of Significance, a
A 5 percent significance level has been selected. Use the Excel file Finding_CVs_p-values.xlsx to find
the critical value or values. Report the critical value or values here:
Question 4: What is (are) the critical values(s)?
Answer:
Expert Solution
This question has been solved!
Explore an expertly crafted, step-by-step solution for a thorough understanding of key concepts.

Step by step
Solved in 2 steps

Recommended textbooks for you
MATLAB: An Introduction with Applications
Statistics
ISBN:
9781119256830
Author:
Amos Gilat
Publisher:
John Wiley & Sons Inc

Probability and Statistics for Engineering and th…
Statistics
ISBN:
9781305251809
Author:
Jay L. Devore
Publisher:
Cengage Learning

Statistics for The Behavioral Sciences (MindTap C…
Statistics
ISBN:
9781305504912
Author:
Frederick J Gravetter, Larry B. Wallnau
Publisher:
Cengage Learning
MATLAB: An Introduction with Applications
Statistics
ISBN:
9781119256830
Author:
Amos Gilat
Publisher:
John Wiley & Sons Inc
Probability and Statistics for Engineering and th…
Statistics
ISBN:
9781305251809
Author:
Jay L. Devore
Publisher:
Cengage Learning
Statistics for The Behavioral Sciences (MindTap C…
Statistics
ISBN:
9781305504912
Author:
Frederick J Gravetter, Larry B. Wallnau
Publisher:
Cengage Learning

Elementary Statistics: Picturing the World (7th E…
Statistics
ISBN:
9780134683416
Author:
Ron Larson, Betsy Farber
Publisher:
PEARSON

The Basic Practice of Statistics
Statistics
ISBN:
9781319042578
Author:
David S. Moore, William I. Notz, Michael A. Fligner
Publisher:
W. H. Freeman

Introduction to the Practice of Statistics
Statistics
ISBN:
9781319013387
Author:
David S. Moore, George P. McCabe, Bruce A. Craig
Publisher:
W. H. Freeman