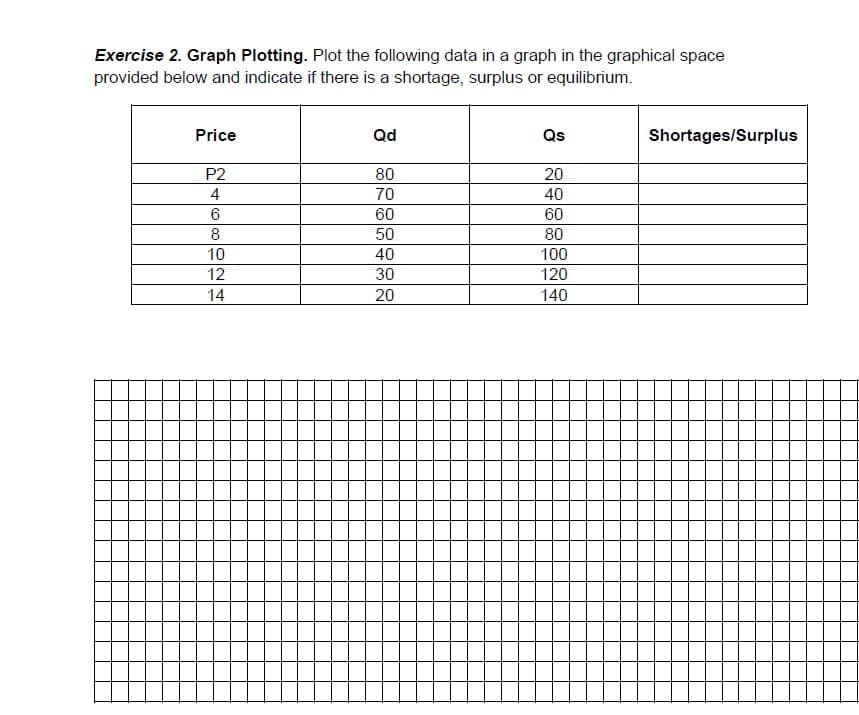
Exercise 2. Graph Plotting. Plot the following data in a graph in the graphical space provided below and indicate if there is a shortage, surplus or equilibrium. Price Qd Qs Shortages/Surplus P2 4 80 20 40 70 60 60 8 50 80 10 40 100 12 30 120 14 20 140


Q: Activity 1. Answer the following questions: a. Illustrate and explain how consumer equilibrium is…
A: a. The term "consumer equilibrium" refers to a condition in which a consumer achieves maximum…
Q: Sandra consumes water and apples. Water is an inferior good to her, apples are a normal good to her.…
A: Consider the below points: * Rise in price leads to a decrease in quantity. *Water is inferior good.…
Q: /ID 19 an income M. As a result of lockdowns, markets for experiences were significantly curtailed.…
A: The microeconomic theory of utility maximization states how a consumer chooses his optimal…
Q: Refer to the budget line shown in the diagram below. If the consumer's money income is $20, the: 10…
A: Given: Consumer income=$20 Quantity of D=10 Quantity of C=5 To find: Prices of C and D.
Q: price of coffee doubles. 2, Use the line drawing tool to show the new budget line. Label this line…
A: A budget line is a straight line that incline downwards and comprises of all the conceivable bundle…
Q: Exhibit 6-7 Marginal utility for sandwiches and sodas Quantity Sandwiches Sodas 1 10 5 2…
A: The marginal utility is the utility which is obtained from consuming one more unit of the commodity…
Q: On the diagram to the right is plotted a single bundle of 2 books and 3 DVDS consumed per month.…
A: In the question above, it is given a plotted diagram of a single bundle of 2 books and 3 DVDs…
Q: 1.Amy's utility function is U(X,Y)= X(Y+3). Luke's utility function is U(X,Y)= X^2+Y . Each person…
A: Answer: Given: Amy's utility function: UX,Y=XY+3 luke's utility function: UX,Y=X2+Y Price of…
Q: #69
A: Q 69) a) Price of each sculpture is x dollars Quantity of sculpture (y) y = 500 – 5x Revenue (R(x))…
Q: 3. A consumer is observed to display the following: MUy P, MU, P MU; and MU, are the marginal…
A: Since you have posted multiple questions, we will solve the first one for you. If you want any…
Q: . It is a hot day, and Bert is thirsty. Here is the value heplaces on each bottle of water:Value of…
A: a. Bert's demand schedule : Prices ($) Quantity demanded More than 7 0 5-7 1 3-5 2 1-3 3…
Q: Using graph, explain when consumer maximize his utility? - Draw the graph Explanation
A: The complete enjoyment derived from consuming an item or service is referred to as utility in…
Q: a)Assume that the typical consumer always spends a small share of her overall budget on Vietnamese…
A: Total customers = 120,000 Price of other products = Pm= $1 Price of Vietnamese Meals = Pv The…
Q: 3.1. Explain, with the aid of examples, the following economic concepts in terms of utility theory:…
A: Utility means satisfaction which is derived by the consumption of goods and services . There are…
Q: An individual sets aside a certain amount of his income per month to spend on his two hobbies,…
A: In economics, the demand curve is used to graphically represent the relationship between quantity…
Q: Activity 2. DIRECTION: Illustrate/draw examples of normal goods and inferior goods on their…
A: Normal goods Inferior goods 1. A normal good is one that generates more demand and hence enhances…
Q: mr haroon has limited income which has spend on goods x and y, market price of x is rs 30 per unit…
A: Budget line(BL) shows various amounts of two goods(here, X & Y) which can be bought by a…
Q: 34. Refer to Figure#6. If the consumer was initially at point A in the figure, a movement from point…
A: Microeconomics studies the economic behavior of the individual units such as a firm, a market, a…
Q: Bob Toshida has the demand schedule for dress shirts shown in the table below. Fill in the missing…
A:
Q: BED 2206: INTERMEDIATE MICROECONOMICS Instructions: Answer all questions QUESTION ONE 1.…
A: Note:- Since we can only answer one question at a time, we'll answer the first one. Please repost…
Q: 9. Using separate diagrams illustrate the income and substitution effects of a price increase for an…
A: Inferior goods: Inferior goods are a sort of good whose demand diminishes as consumer income rises…
Q: Dali enjoys cool drink (c) and steak (s) for lunch. His monthly lunch budget is R600. His total…
A: "In order to meet their needs, consumers purchase goods and services. The consumer equilibrium is…
Q: Question 3 (Budget Constraint). Vince consumes gas (x1) and food (x2). Suppose the price of gas is…
A: Dear student, you have asked multiple sub-part questions in a single post. In such a case, I will be…
Q: ncome per week= $60 $12 per ticket $6 per burger Points A and B are utility maximizing choices.…
A: Income effect + Subsitution effect = Price effect.
Q: Walmart recently asked Mondelez, owner of Oreos to bring back a new-and-improved version of its…
A: The product is being preferred by many consumers through social media as their best option for…
Q: 6. Given u = 3x, +x,x, + 2x, s.t. P1X + P2x2 = B Find the amount of the commodities at which utility…
A: Given; Utility function; u=3x1+x1x2+2x2 Budget constraint; p1x1+p2x2=B Utility will be maximized…
Q: 1. Suppose someone's budget is $780, and it is fully spent on buying Product A. The price of this…
A: Income available to spend on product A is $780 Price of product A is $26 => Units purchased with…
Q: Problem 6 Consider the following diagram that shows the effects of a decrease in the price of beer…
A: Since you have asked a multi-part question and according to the policy we can only solve the first 3…
Q: Quantity of Y 5 4. 1 3 4 5 6. 9. 10 Quantity of X Figure 1 Refer to Figure 1. The consumer…
A: The above graph shows the consumer equilibrium in a two commodity case. Given the utility from two…
Q: Question No. 5| Hafidh's income is $200 a month. The price of watch is $25 a show, and the price of…
A: Given, Income = $200 Price of watch = $25 Price of jeans = $15
Q: Illustrate and explain how consumer equilibrium is achieved using the indifference curve? Discuss…
A: "Since you have asked multiple questions, we will solve the first question for you. If you want any…
Q: U = 340x1 +960x2 + 2x1x2 – 2x – /2, when the weekly amount of leisure is x1 = 132 and earned income…
A: Since you have posted a question with multiple subparts, we will solve only first three subparts for…
Q: Diana Vreeland has the budget constraints shown below. If Diana Vreeland's the budget line shifts…
A: Initial Budget Line=BB A budget line tells how much units of each good the consumer consumes given…
Q: he diagram to the right illustrates a hypothetical demand curve representing the elationship between…
A: The length of AC is 26, i.e., 64 - 38 The length of BC is 26,000, i.e., 52,000 - 26,000
Q: Оиestion 4: In Figure below a budget constraint is shown. If PY (the price of good Y) is $6, what is…
A: Budget constraint is a representation of the bundles of goods and services that a consumer can buy…
Q: Q2) Ali’s budget line relating good X and good Y has intercept of 50 unit of good X and 20 units of…
A: NOTE: We’ll answer the first question since the exact one wasn’t specified. Please submit a new…
Q: Consumer spends $450 per week on two goods, X and Y. PX= $5 and PY=$3. His utility function is U=…
A: Given Information: Consumer spends =$450 per week Two goods = X and Y price of X and Y : Px = $5…
Q: 6. An individual demand curve slopes downward to the right because of the
A: The law of demand establishes a negative correlation between the price and the quantity demanded of…
Q: The figure below shows a consumer maximizing utility at two different prices (the left panel) and…
A: From the utility maximizing point A : Consumption of x = 24 Consumption of y = 48 From Graph 2 :…
Q: A consumer has income of 15000. Masks costs $35 per mask, and sanitizers cost $70 per bottle.…
A:
Q: Mr. Haroon has limited income which he spends on goods X and Y, market price of X is Rs. 30 per unit…
A: Given, Price of good X = PX = Rs. 30 Price of good Y = PY = Rs. 40 Let assume the income of Mr…
Q: Task 4. Five consumers have the following marginal utility of apples and pears: Apples (MU) Pears…
A: Since you have asked multiple questions, we will solve the first question for you. If youwant any…
Q: Find the quantity of each good the consumer will purchase in the cases shown in the table below.…
A: Case A Budget = 7 $ Price of grapes = 1 $ Quantity purchased with 7 $ = 7 / 1 = 7 grapes Or Price of…
How do I answer this problem?

Step by step
Solved in 2 steps with 1 images

- If a 10 decrease in the price of one product that you buy causes an 8 increase in quantity demanded of that product, will another 10 decrease in the price cause another 3 increase (no more and no less) in quantity demanded?Plot the price and quantity data given in the demand schedule of exercise 1. Put price on the vertical axis and quantity on the horizontal axis. Indicate the price elasticity value at each quantity demanded. Explain why the elasticity value gets smaller as you move down the demand curve.Income Effects depend on the income elasticity of demand for each good limit you buy. If one of the goods you buy has a negative income elasticity, that is, it is an inferior good, what must be true of the income elasticity of the other good you buy?
- What happens to the equilibrium price and quantity of a good (such as alcohol) if you prohibit its use and sale? Demonstrate using supply and demand graphical analysis.Graph the supply and demand curves and use the midpoint (averages) formula to calculate the respective price elasticities of supply and demand over the price range given. Then determine over what range of prices supply and demand are elastic, unit elastic, or inelastic. Es QS Price QD Ed 2400 14 0 2200 12 500 1900 10 1000 1500 8 1500 1000 6 2000 500 4 2500Consider each scenario independently. In each of the following cases tell me, usingwritten and graphical analysis (a - g). For Question 1. – 7. please see details below:Include the correct increase / decrease in the demand or supply include correct labelsinclude what will happen to the equilibrium priceinclude what will happen to the equilibrium quantityInclude a brief explanation What will happen in the market for lobster if the government rises the income tax and lobsters are a normal good? create graph
- "Standard tickets for Beyonce’s Renaissance tour went on sale in the UK for a price of£56 in February 2023. Many fans complained about receiving constant errormessages and being stuck in long on-line queues of more than 500,000 people." What is the relationship between the price of a ticket and the quantity of tickets demanded by consumers, and how does this affect the market for Beyonce's Renaissance tour? (Include diagram)Question Earlier this year, 2021, the price of chicken meat rose unexpectedly reached to 250/ kilo at peak from the previous price of 170/ kilo. This 68% increase of price per kilo was primarily caused by excess demand for chicken meat. This is the result of the decrease in consumption for pork meat due to the threat of African Swine Flu (ASF). However, even though consumer shifted preferences, the increase in the price of chicken was perceived to be too high for the budget of consumers. Therefore, sellers realized decrease in their daily aggregate sales from 1,000 kilos to 700 kilos. 1. Illustrate the change in the market equilibrium through a graph. 2. What presumably happened to the total revenues of the sellers during the price hike period? a.) Compute the price elasticity of demand b.) Derive the total revenue before the hike (TR1), and after the hike (TR2).Consider each scenario independently. In each of the following cases tell me, usingwritten and graphical analysis (a - g). For Question 1. – 7. please see details below:Include the correct increase / decrease in the demand or supply include correct labelsinclude what will happen to the equilibrium priceinclude what will happen to the equilibrium quantityInclude a brief explanation1. What will happen in the market for wine if the price of cheese increases (wine andcheese are complements
- Yousuf is going to market on 8.4.2021 with 10 OMR and he purchases 5 kilograms of the product which is 2 OMR per kilogram. When he went the next day with 20 OMR the price did not change and he purchased 10 kilograms of the product. The change in demand here discussed here is ________. a. Downward movement of supplier on the supply curve b. Upward movement of the supplier on the supply curve c. Rightward shift of the consumer on the demand curve d. Leftward shift of the consumer on the demand curvePlot the demand curve from the demand schedule information provided. (see uploaded image) (a) What can you explain from the graph? (b) Can you identify any determinants? (c) What happens if price changes? (d) What else do you think will happen? (e) What happens if other determinants change?Exercise 1. The demand for your product X has been estimated to be QX = 7, 880 − 4PX − 2PY + PZ − 0.1M where Y and Z are other (related) products. The relevant price and income data are asfollows: PX = 10, PY = 15, PZ = 50, M = 40, 000 b. Is X an inferior or a normal good? d. Graph the demand curve for X given the above information.e. How will the demand curve change if M falls to 35, 000? Is that in line with b.?


