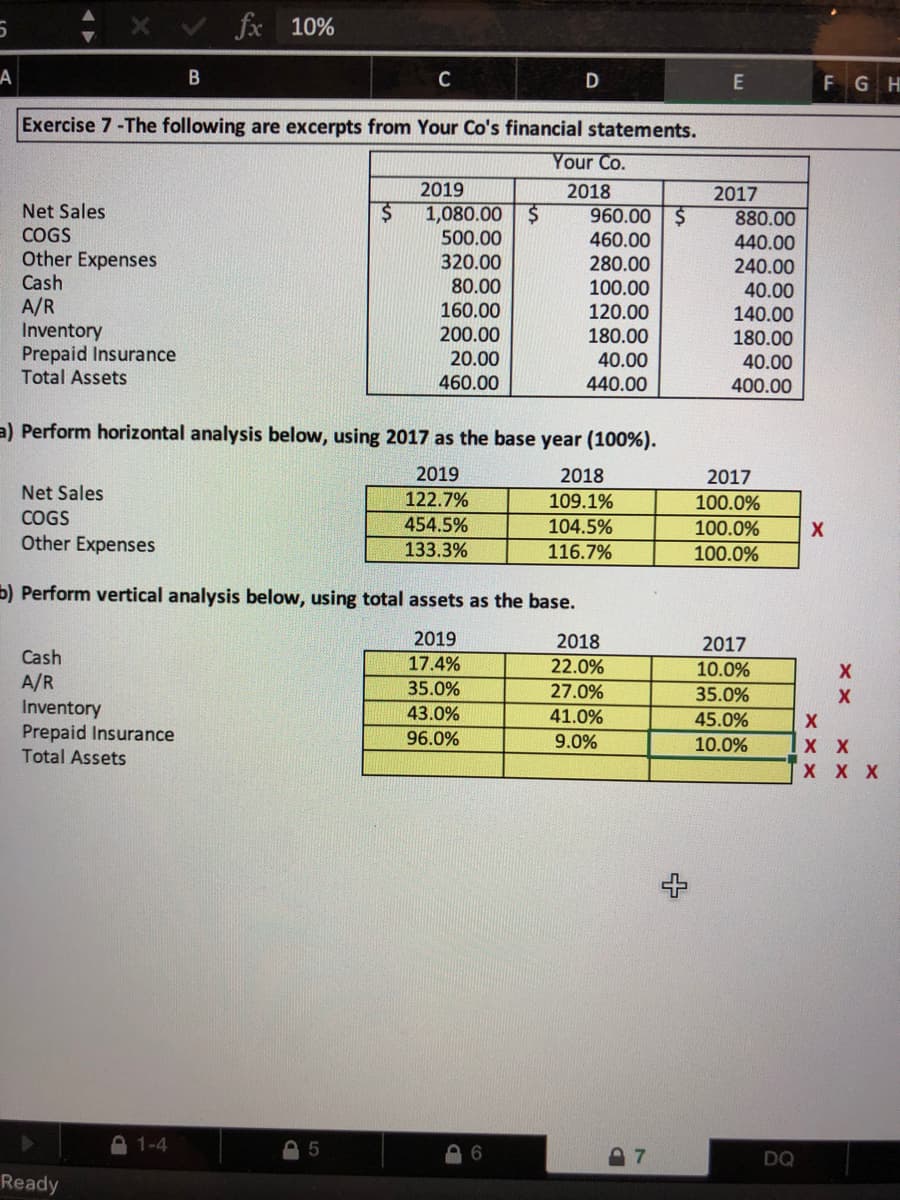
Exercise 7-The following are excerpts from Your Co's financial statements. Your Co. 2019 2018 2017 Net Sales COGS Other Expenses Cash A/R Inventory Prepaid Insurance Total Assets 1,080.00 960.00 $ 460.00 280.00 500.00 320.00 80.00 160.00 200.00 100.00 120.00 180.00 40.00 440.00 880.00 440.00 240.00 40.00 140.00 180.00 40.00 400.00 20.00 460.00 a) Perform horizontal analysis below, using 2017 as the base year (100%). 2019 2018 2017 Net Sales 122.7% 109.1% 100.0% COGS 454.5% 104.5% 100.0% Other Expenses 133.3% 116.7% 100.0% p) Perform vertical analysis below, using total assets as the base. 2019 2018 2017 Cash 17.4% 22.0% 10.0% A/R Inventory Prepaid Insurance Total Assets 35.0% 27.0% 35.0% 43.0% 41.0% 45.0% 96.0% 9.0% 10.0% x x x
Exercise 7-The following are excerpts from Your Co's financial statements. Your Co. 2019 2018 2017 Net Sales COGS Other Expenses Cash A/R Inventory Prepaid Insurance Total Assets 1,080.00 960.00 $ 460.00 280.00 500.00 320.00 80.00 160.00 200.00 100.00 120.00 180.00 40.00 440.00 880.00 440.00 240.00 40.00 140.00 180.00 40.00 400.00 20.00 460.00 a) Perform horizontal analysis below, using 2017 as the base year (100%). 2019 2018 2017 Net Sales 122.7% 109.1% 100.0% COGS 454.5% 104.5% 100.0% Other Expenses 133.3% 116.7% 100.0% p) Perform vertical analysis below, using total assets as the base. 2019 2018 2017 Cash 17.4% 22.0% 10.0% A/R Inventory Prepaid Insurance Total Assets 35.0% 27.0% 35.0% 43.0% 41.0% 45.0% 96.0% 9.0% 10.0% x x x

Corporate Financial Accounting
14th Edition
ISBN:9781305653535
Author:Carl Warren, James M. Reeve, Jonathan Duchac
Publisher:Carl Warren, James M. Reeve, Jonathan Duchac
Chapter10: Liabilities: Current, Installment Notes, And Contingencies
Section: Chapter Questions
Problem 10.1EX: Current liabilities Bon Nebo Co. sold 25,000 annual subscriptions of Bjorn for 85 during December...

Related questions
Question
Transcribed Image Text:fx
10%
C
E
F GH
Exercise 7-The following are excerpts from Your Co's financial statements.
Your Co.
2019
1,080.00 $
500.00
320.00
2018
2017
Net Sales
COGS
Other Expenses
Cash
A/R
Inventory
Prepaid Insurance
Total Assets
960.00 $
880.00
460.00
280.00
100.00
120.00
440.00
240.00
40.00
140.00
80.00
160.00
200.00
20.00
180.00
180.00
40.00
40.00
400.00
460.00
440.00
a) Perform horizontal analysis below, using 2017 as the base year (100%).
2019
2018
2017
Net Sales
122.7%
109.1%
100.0%
100.0%
100.0%
COGS
454.5%
104.5%
Other Expenses
133.3%
116.7%
b) Perform vertical analysis below, using total assets as the base.
2019
2018
2017
Cash
17.4%
22.0%
10.0%
A/R
Inventory
Prepaid Insurance
Total Assets
35.0%
27.0%
35.0%
43.0%
41.0%
45.0%
96.0%
9.0%
10.0%
хх
X X X
1-4
DQ
Ready
Expert Solution
This question has been solved!
Explore an expertly crafted, step-by-step solution for a thorough understanding of key concepts.

This is a popular solution!

Trending now
This is a popular solution!

Step by step
Solved in 2 steps with 4 images

Knowledge Booster


Learn more about
Need a deep-dive on the concept behind this application? Look no further. Learn more about this topic, accounting and related others by exploring similar questions and additional content below.Recommended textbooks for you
Corporate Financial Accounting
Accounting
ISBN:
9781305653535
Author:
Carl Warren, James M. Reeve, Jonathan Duchac
Publisher:
Cengage Learning

Financial & Managerial Accounting
Accounting
ISBN:
9781285866307
Author:
Carl Warren, James M. Reeve, Jonathan Duchac
Publisher:
Cengage Learning
Corporate Financial Accounting
Accounting
ISBN:
9781305653535
Author:
Carl Warren, James M. Reeve, Jonathan Duchac
Publisher:
Cengage Learning
Financial & Managerial Accounting
Accounting
ISBN:
9781285866307
Author:
Carl Warren, James M. Reeve, Jonathan Duchac
Publisher:
Cengage Learning