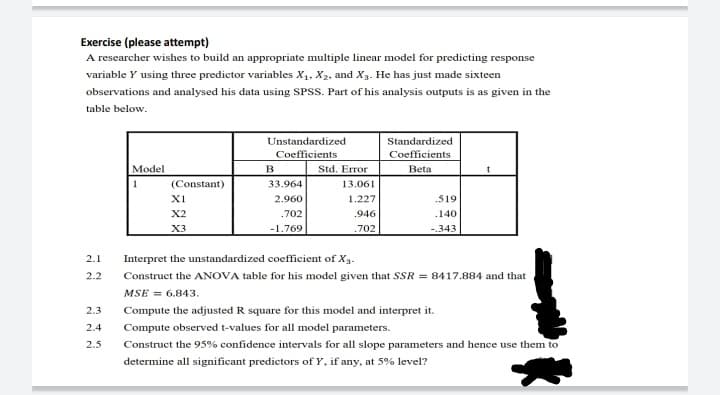
Exercise (please attempt) A researcher wishes to build an appropriate multiple linear model for predicting response variable Y using three predictor variables X1, X2, and Xg. He has just made sixteen observations and analysed his data using SPSS. Part of his analysis outputs is as given in the table below. Unstandardized Coefficients Standardized Coefficients Model B Std. Error Beta (Constant) 33.964 13.061 XI 2.960 1.227 .519 X2 702 .946 .140 X3 -1.769 .702 -.343 2.1 Interpret the unstandardized coefficient of Xg. 2.2 Construct the ANOVA table for his model given that SSR = 8417.884 and that MSE = 6.843. 2.3 Compute the adjusted R square for this model and interpret it.


Correlation
Correlation defines a relationship between two independent variables. It tells the degree to which variables move in relation to each other. When two sets of data are related to each other, there is a correlation between them.
Linear Correlation
A correlation is used to determine the relationships between numerical and categorical variables. In other words, it is an indicator of how things are connected to one another. The correlation analysis is the study of how variables are related.
Regression Analysis
Regression analysis is a statistical method in which it estimates the relationship between a dependent variable and one or more independent variable. In simple terms dependent variable is called as outcome variable and independent variable is called as predictors. Regression analysis is one of the methods to find the trends in data. The independent variable used in Regression analysis is named Predictor variable. It offers data of an associated dependent variable regarding a particular outcome.

Step by step
Solved in 2 steps


