Explain the reason why the forecast for City A is more reliable than the forecast for the City B. Justify your answer.
Explain the reason why the forecast for City A is more reliable than the forecast for the City B. Justify your answer.

Algebra & Trigonometry with Analytic Geometry
13th Edition
ISBN:9781133382119
Author:Swokowski
Publisher:Swokowski
Chapter5: Inverse, Exponential, And Logarithmic Functions
Section5.6: Exponential And Logarithmic Equations
Problem 68E

Related questions
Question
QUESTION 3
Based on the image attached, shows the forecasted temperature for two cities is given in the table below.
Explain the reason why the forecast for City A is more reliable than the forecast for the City B. Justify your answer.
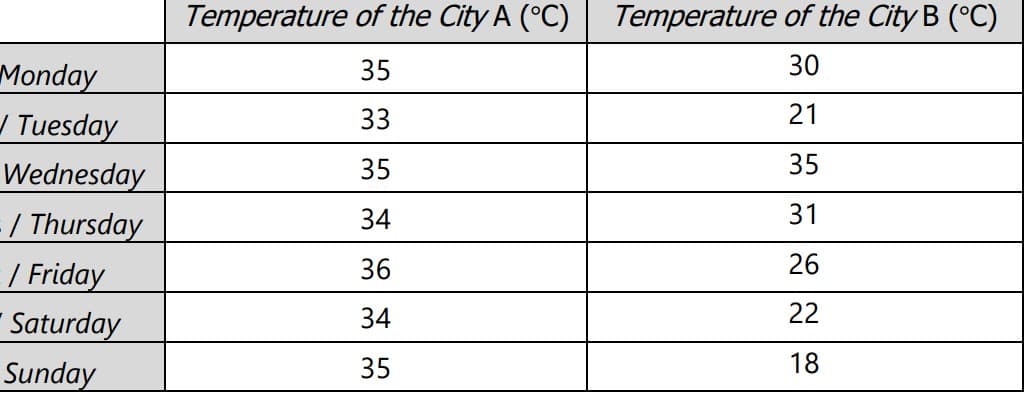
Transcribed Image Text:Monday
Tuesday
Wednesday
- / Thursday
/ Friday
Saturday
Sunday
Temperature of the City A (°C)
35
33
35
34
36
34
35
Temperature of the City B (°C)
30
21
35
31
26
22
18
Expert Solution
This question has been solved!
Explore an expertly crafted, step-by-step solution for a thorough understanding of key concepts.

Step by step
Solved in 3 steps

Recommended textbooks for you
Algebra & Trigonometry with Analytic Geometry
Algebra
ISBN:
9781133382119
Author:
Swokowski
Publisher:
Cengage

Mathematics For Machine Technology
Advanced Math
ISBN:
9781337798310
Author:
Peterson, John.
Publisher:
Cengage Learning,
Algebra & Trigonometry with Analytic Geometry
Algebra
ISBN:
9781133382119
Author:
Swokowski
Publisher:
Cengage
Mathematics For Machine Technology
Advanced Math
ISBN:
9781337798310
Author:
Peterson, John.
Publisher:
Cengage Learning,