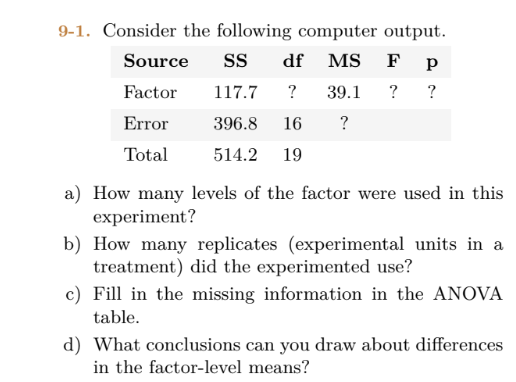
9-1. Consider the following computer output. Source SS df MS F p 117.7 ? 39.1 ? ? Factor Error 396.8 16 ? Total 514.2 19 a) How many levels of the factor were used in this experiment? b) How many replicates (experimental units in a treatment) did the experimented use? c) Fill in the missing information in the ANOVA table.


Q: You generate a scatter plot using Excel. You then have Excel plot the trend line and report the…
A: We have given that y = 49.18x + 40.52 r2 = 0.5041
Q: Consider 2 variables X and Y. The data for X has a mean of 10 and standard deviation of 3. The data…
A: From the given information, sX=3, sY=6, and r=-0.4.
Q: When should you do regression analysis?
A: Regression analysis is used when you…
Q: 1. As of August 12, 2021, these are the countries with confirmed COVID-19 cases ranging from one to…
A: Measures of central tendency A measure of central tendency (also named as measures of center or…
Q: If Z is a standard normal random variable, find x such that IP(|Z| > x) = 0.05 -1.96 1.645 1.96…
A:
Q: Your Conclusion (Based on Your Sample) I Don't See Anything (Nonsignificant) The Truth (Based on…
A: Given : The Truth (Based on…
Q: A firm has classified its customers in two ways: according to whether the account is overdue and…
A: To find: One account is selected at random. A. If the account is overdue, what is the probability…
Q: 15 mothers were asked which brand of milk they prefer for their children. The choices are Nido,…
A: "A certainty span is a scope of values that is probably going to incorporate" the "populace…
Q: 2. Using the measures of dispersion, describe the population of the world's top ten (10) crowded…
A: Given data is City Country Population Tokyo Japan 37,435,191 Delhi India 29,399,141…
Q: lower completion rate. (a) State the null and alternative hypotheses in words. (b) State the null…
A: Given that proportion of getting a degree in six years is 0.389
Q: You wish to test the following claim (H) at a significance level of a = 0.01. H₂:μ = 62.9 Ηα:μ #…
A: Given data , n= 7 M= 70 SD= 13.6 Level of significant / Alpha = 0.01 We have to find out test…
Q: On the Navajo Reservation, a random sample of 210 permanent dwellings in the Fort Defiance region…
A: Let p1 be the population proportion of all traditional hogans in the Fort Defiance region, and let…
Q: Suppose x has a distribution with a mean of 30 and a standard deviation of 4. Random samples of size…
A: We have given that x has a distribution with a mean of 30 and a standard deviation of 4. μ=30σ=4 The…
Q: A researcher is studying the average cost of traveling for a college student. As part of their…
A: 2a) The test hypotheses are: Null hypothesis: H0: μ = 100. Alternative hypothesis: H1: μ ≠ 100.
Q: Consider an experiment with sample space S = {A,B,C}. If P(A)=0.3, P(B)=0.5, and P(C)=0.2, then (a)…
A:
Q: The Venn diagram below shows the 14 students in Ms. Henderson's class. The diagram shows the…
A:
Q: Find the indicated area under the standard normal curve. To the left of z= -1.23 Click here to view…
A:
Q: Graph 1. Line Graph of COVID-19 cases in the Philippines since March 15-June 27, 2020 New cases…
A: The above question line graph and bar chart is given based on the number of COVID-19 cases in the…
Q: In a survey of 205 people, the following data were obtained relating gender to color-blindness:…
A: I solved exactly first 3 subparts because of bartleby policy...... Given data; Color-Blind (C)…
Q: Watch your cholesterol: The mean serum cholesterol level for U.S. adults was 202, with a standard…
A:
Q: A random variable has a continuous uniform distribution with 10 < X < 20. What is the density…
A: Hey there! Thank you for posting the question. Since your question has more than 3 parts, we are…
Q: n a poll, 37% of the people polled answered yes to the question "Are you in favor of the death…
A: The following information has been given: Sample Proportion : p^=0.37 Margin of error : E=0.05
Q: A researcher wishes to determine whether the blood pressure of vegetarians is, on average, lower…
A: Given Information: Vegetarians: Sample size n1=85 Sample mean x¯1=124.1 Sample standard deviation…
Q: Consider an experiment with sample space S = {A,B,C}. If P(A)=0, P(B)=0.6, and P(C)=0.4, then (a) P(…
A: Given;an experiment with sample space (S);S={A,B,C}P(A)=0P(B)=0.6P(C)=0.4
Q: 1. Find the area under the standard normal curve (μ = 0, 0 = 1) (a) outside the interval (-1, +1).…
A: Given data: Find the area under the standard normal curve (mu = 0, sigma = 1 ) To find: (a) outside…
Q: he following table shows site type and type of pottery for a random sample of 628 sherds at an…
A: Chi square test statistic is used to test the independency of the observations. It explains…
Q: The students in a class are selected at random, one after another, for an examination. Find the…
A:
Q: side a bell jar, and chemical vapors are introduced. The susceptor is rotated and heat is applied…
A: Replicate A B epitaxial layer thickness 1 Low Low 14.037 High Low 16.165 Low High 13.972…
Q: How do you think you would know how far from normal your data can be for a robust test to still…
A: The objective of factual testing is to find the worth of a boundary where the likelihood of that…
Q: After a polution event in an estuary, we want to estimate proportion of shell fish that are impacted…
A: The question is about sample size estimation Given : Confidence level = 0.95 CI is no more than ±…
Q: b. Draw the following graphs: 1. Histogram
A: b) 1. Histogram The process of making a histogram using the given data is described below: Step 1:…
Q: A sample of 10 cam shafts intended for use in gasoline engines has an average eccentricity of 1.02…
A:
Q: 23. Busy Bank Tellers. The Prescott National Bank has six tellers available to serve customers. The…
A: Hi! Thank you for the question, As per the honor code, we are allowed to answer three sub-parts at a…
Q: Table 3a: SPSS output - Levene's Test of mean incomes Levene Statistic Sig. .136 Write the…
A: Since you have posted a question with multiple subparts, we will solve first three subparts for you.…
Q: 1. As of August 12, 2021, these are the countries with confirmed COVID-19 cases ranging from one to…
A: * SOLUTION :- From the given information the calculation is given as below as
Q: Define the random variable Z = U + V. a) Determine the joint probability mass function pu,z (u, z) =…
A: Given that U and V are independent r.v.s following geometric distn with pmf
Q: Your teacher recently found an old Nintendo in a thrift store. Use the formula to predict the value…
A: Regression equation are used to predict the future value. It explains the relationship between the…
Q: In a random sample of 500 children from Illinois, 143 were undernourished. Use these sample data to…
A: Assumptions: The data are selected randomly. If np≥ and nq≥10 then the distribution follows…
Q: PROBLEM 4 The Pee Tool Shop has four heavy presses it uses to stamp out prefabricated metal covers…
A: * SOLUTION :- (4) From the given information the calculation is given as below.
Q: A Certain of the time 183 flight arrives on time 86 percent Suppose Flights are randomly. Selected.…
A: Since you have posted a question with multiple sub-parts, we will solve first three subparts for…
Q: The null and alternative hypotheses are given. Determine whether the hypothesis test is…
A: Null hypothesis : A hypothesis of "no difference" is called as null hypothesis. Alternative…
Q: tions for which information is available on voter turnout (percentage of the voting age population)…
A: Country Year % Turnout 1 Burkina Faso 2005 36.4 2 Cape Verde 2006 78.59 3 central African…
Q: Bryse is 27 years old. Based on a normal distribution with mean 47.8 years and standard deviation…
A: GivenBryse is 27 years oldx=27Mean(μ)=47.8standard deviation(σ)=12.6
Q: The Olympics host city is chosen from a list of candidate cities. Members of the International…
A: Decision making can be made by various method. The election result are predicted before each…
Q: 470 of Use tilraph de and graph to identify the value is given 485 500 کاک ( What is the 530 The…
A: From the given graph we know that μ=530μ+σ=545 .....(1)μ-σ=515 ......(2)
Q: Find the area of the shaded region. The graph to the right depicts IQ scores of adults, and those…
A: Given datamean=100standard deviation=15
Q: On January 3, Pronghorn Corp. purchased three portable electronic keyboards for $590 each. On…
A:
Q: 15. Consider this upper-tail hypothesis test: Ho: p ≤ 0.70 against H₁: p > 0.70. If a random sample…
A:
Q: A random sample of 16 chemists from Washington state shows an average salary of $41431 with a…
A: Given Data: Significance level = 0.01 Critical value = 2.454
Q: Calculate the test-statistic, t with the following information. n1 = 60, ₁ = 2.1, $₁ = 0.63 n2 = 55,…
A:

Step by step
Solved in 4 steps

- 5.39 ● The following data on degree of exposure to 242Cmalpha particles (x) and the percentage of exposed cellswithout aberrations (y) appeared in the paper “Chromosome Aberrations Induced in Human Lymphocytes by D-TNeutrons” (Radiation Research [1984]: 561–573):The number of contaminating particles on a silicon waferprior to a certain rinsing process was determined for eachwafer in a sample of size 100, resulting in the followingfrequencies:Number of particles 0 1 2 3 4 5 6 7Frequency 1 2 3 12 11 15 18 10Number of particles 8 9 10 11 12 13 14Frequency 12 4 5 3 1 2 1a. What proportion of the sampled wafers had at leastone particle? At least five particles?b. What proportion of the sampled wafers had betweenfive and ten particles, inclusive? Strictly between fiveand ten particles?c. Draw a histogram using relative frequency on thevertical axis. How would you describe the shape of thehistogram?What are the approximate numbers of participants needed for each of the following planned studies to have 80% power, assuming equal numbers in the two groups and all using the 0.05 significance level? (Be sure to give the total number of participants needed, not just the number needed for each group.) Expected Means Study M1 M2 Expected SPooled Tails (a) 106.0 122.4 82.0 1 (b) 42.7 17.1 32.0 2 (c) 10.0 8.8 2.4 1 (d) 477.0 502.0 50.0 2 Approximate Number of Participants Needed in Each Group (Assuming Equal Sample Sizes) for 80% Power for the t Test for Independent Means, Testing Hypotheses at the 0.05 Significance Level Effect Size Small (0.20) Medium (0.50) Large (0.80) One-tailed 310 50 20 Two-tailed 393 64 26
- Independent studies show that 26 out of 40 r/s full-time students favor a shorter semester system, while 38 out of 50 r/s part-time students favor the same. Construct a 98% c.i. for the difference between the overall percentage of full-time students favoring a shorter semester system and that of part-time students.1. In the book Design and Analysis of Experiments, 8th edition (2012, John Wiley & Sons), the results of an experiment involving a storage battery used in the launching mechanism of a shoulder-fired ground-to-air missile were presented. Three material types can be used to make the battery plates. The objective is to design a battery that is relatively unaffected by the ambient temperature. The output response from the battery is effective life in hours. Three temperature levels are selected, and a factorial experiment with four replicates is run. The data are as follows: Table 11.(a) Test the appropriate hypotheses and draw conclusions using the analysis ether either firing temperature or furnace position affects the baked density of a carbon anode. The data are as follows: Table 12.(a) State the hypotheses of interest. (b) Test the hypotheses in part (a) using the analysis of variance with a = 0.05. What are your conclusions? (c) Analyze the residuals from this experiment. (d)…An industrial-organizational psychologist believes that implementing a 2-hour lunch break at US companies will have an effect on employee productivity. On a productivity scale from 1 to 15, the average productivity score for all companies in the US is 8 (u = 8.00, ỡ = 4.00). The IO psychologist randomly samples 5 companies and has the companies implement a 2-hour lunch break for 1 month. At the end of the month, the lO psychologist measures the productivity scores for the five companies and obtains the following scores: 9, 14, 10, 12, 15 Using the appropriate hypothesis test and the six steps of hypothesis testing, determine what the 10 psychologist should conclude about the effect of a 2-hour lunch break on employee productivity. 1) What are the null and alternative hypotheses 2)Construct a sampling distribution of means representing the null hypothesis. Specify the sampling distribution's mean and standard error 3)Using a two-tailed alpha of .05 (a = 05), determine the critical…
- An industrial-organizational psychologist believes that implementing a 2-hour lunch break at US companies will have an effect on employee productivity. On a productivity scale from 1 to 15, the average productivity score for all companies in the US is 8 (u = 8.00, ỡ = 4.00). The IO psychologist randomly samples 5 companies and has the companies implement a 2-hour lunch break for 1 month. At the end of the month, the lO psychologist measures the productivity scores for the five companies and obtains the following scores: 9, 14, 10, 12, 15 Using the appropriate hypothesis test and the six steps of hypothesis testing, determine what the 10 psychologist should conclude about the effect of a 2-hour lunch break on employee productivity. 1. What is the appropriate test to use ? 2. List the test's assumptions .You do NOT have to test the assumptions. 3. What are the null and alternative hypotheses ? 4. Construct a sampling distribution of means representing the null hypothesis. Specify the…An industrial-organizational psychologist believes that implementing a 2-hour lunch break at US companies will have an effect on employee productivity. On a productivity scale from 1 to 15, the average productivity score for all companies in the US is 8 (u = 8.00, ỡ = 4.00). The IO psychologist randomly samples 5 companies and has the companies implement a 2-hour lunch break for 1 month. At the end of the month, the lO psychologist measures the productivity scores for the five companies and obtains the following scores: 9, 14, 10, 12, 15 Using the appropriate hypothesis test and the six steps of hypothesis testing, determine what the 10 psychologist should conclude about the effect of a 2-hour lunch break on employee productivity. 1. What is the appropriate test to use ? 2. List the test's assumptions .You do NOT have to test the assumptions. 3. What are the null and alternative hypotheses ? 4. Construct a sampling distribution of means representing the null hypothesis. Specify the…An industrial-organizational psychologist believes that implementing a 2-hour lunch break at US companies will have an effect on employee productivity. On a productivity scale from 1 to 15, the average productivity score for all companies in the US is 8 (u = 8.00, ỡ = 4.00). The IO psychologist randomly samples 5 companies and has the companies implement a 2-hour lunch break for 1 month. At the end of the month, the lO psychologist measures the productivity scores for the five companies and obtains the following scores: 9, 14, 10, 12, 15 Using the appropriate hypothesis test and the six steps of hypothesis testing, determine what the 10 psychologist should conclude about the effect of a 2-hour lunch break on employee productivity. 1) write out the null and alternative hypotheses 2) Use an online calculator to calculate the exact p-value
- An industrial-organizational psychologist believes that implementing a 2-hour lunch break at US companies will have an effect on employee productivity. On a productivity scale from 1 to 15, the average productivity score for all companies in the US is 8 (u = 8.00, ỡ = 4.00). The IO psychologist randomly samples 5 companies and has the companies implement a 2-hour lunch break for 1 month. At the end of the month, the lO psychologist measures the productivity scores for the five companies and obtains the following scores: 9, 14, 10, 12, 15 1. State whether you reject or fail to reject the null hypothesis 2. Use an online calculator to calculate the exact p-value 3. Calculate and report the effect size 4. Based on the results of your analysis, does a 2-hour lunch break increase, decrease, or have no effect on productivity ?31% of all pygmy softshell toises have stripes on their shells. A herpetologist in Cititon collects a sample of 28 pygmy softshell tortoises and finds that 8 of them have stripes on their shells. Is there enough evidence to conclude, at a significance of alpha=0.05, that the proportion of pygmy softshell tortoises in Cititon with stripes on their shells is less than 31%? What is the claim? What is the null hypothesis? What is the alternative hypothesis? What is the test statistic? What is/are the critical value(s)? Do we reject the null hypothesis? What conclusion do we draw? What is the P-value for the problem above?A study was conducted in 1997 to measure the total fat content, calories, and sodium content of vegetable burgers available at supermarkets and commonly used as a meat substitute. Measurements on 54 different brands of "veggie burgers," and the results were used to develop the 3-way contingency table below. Under 130 Calories Under 130 Calories 130 Calories or More 130 Calories of More Total Fat Content Under 320 g Sodium 320 g Sodium or More Under 320 g of Sodium 320 g Sodium or More Under 3 g 6 12 1 1 3-4 g 7 4 3 5 Over 4 g 1 1 7 6 A= {"Under 130 Calories"}, B= {"320 g Sodium or More"} C= {"Over 4 g Total Fat"} A vegetable burger is selected randomly from the group. Find the following probabilities: Please Answer D, E, F (d.) P(A and B) (e.) P(A and B and C) (f.) P(A or B)


