f. The equation of the linear regression line is: ŷ (Please show your answers to two decimal places) g. Use the model to predict the GPA of a college student who as had 6 lovers. GPA = (Please round your answer to one decimal place.) h. Interpret the slope of the regression line in the context of the question: O For every additional lover students have, their GPA tends to decrease by 0.18. O As x goes up, y goes down. O The slope has no practical meaning since a GPA cannot be negative. i. Interpret the y-intercept in the context of the question: Olf a student has never had a lover, then that student's GPA will be 3.36. The average GPA for all students is predicted to be 3.36. O The best prediction for the GPA of a student who has never had a lover is 3.36. O The y-intercept has no practical meaning for this study.
f. The equation of the linear regression line is: ŷ (Please show your answers to two decimal places) g. Use the model to predict the GPA of a college student who as had 6 lovers. GPA = (Please round your answer to one decimal place.) h. Interpret the slope of the regression line in the context of the question: O For every additional lover students have, their GPA tends to decrease by 0.18. O As x goes up, y goes down. O The slope has no practical meaning since a GPA cannot be negative. i. Interpret the y-intercept in the context of the question: Olf a student has never had a lover, then that student's GPA will be 3.36. The average GPA for all students is predicted to be 3.36. O The best prediction for the GPA of a student who has never had a lover is 3.36. O The y-intercept has no practical meaning for this study.

Glencoe Algebra 1, Student Edition, 9780079039897, 0079039898, 2018
18th Edition
ISBN:9780079039897
Author:Carter
Publisher:Carter
Chapter4: Equations Of Linear Functions
Section4.5: Correlation And Causation
Problem 24PFA

Related questions
Question
100%
Please solve the unanswered , f-g…..thank you
Transcribed Image Text:Question 12
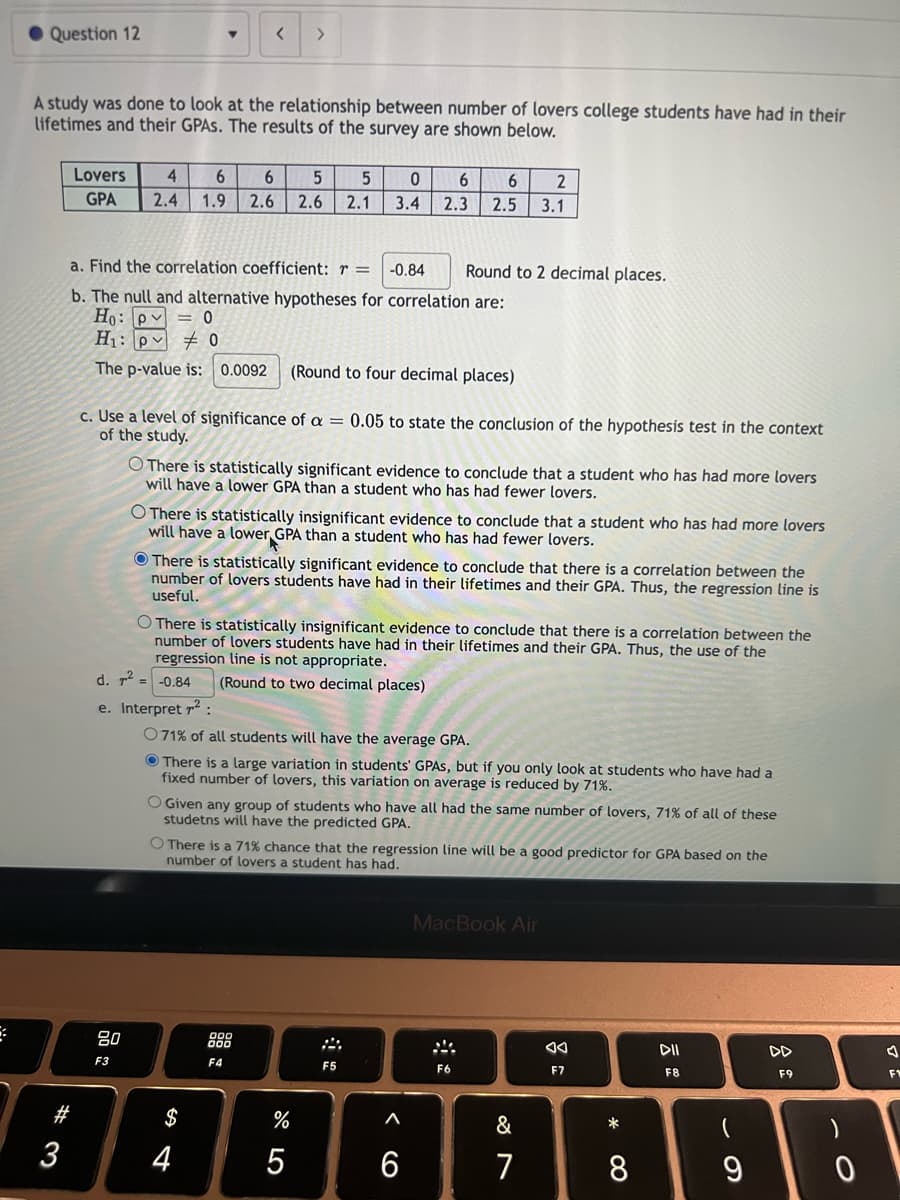
A study was done to look at the relationship between number of lovers college students have had in their
lifetimes and their GPAS. The results of the survey are shown below.
#3
3
Lovers 4 6
GPA 2.4 1.9
a. Find the correlation coefficient: r = -0.84
b. The null and alternative hypotheses for correlation are:
Ho: pv = 0
H₁: p0
The p-value is: 0.0092 (Round to four decimal places)
80
F3
c. Use a level of significance of a = 0.05 to state the conclusion of the hypothesis test in the context
of the study.
6 5 5 0
2.6 2.6 2.1 3.4
d. ² =
e. Interpret 7²:
>
O There is statistically significant evidence to conclude that a student who has had more lovers
will have a lower GPA than a student who has had fewer lovers.
O There is statistically insignificant evidence to conclude that a student who has had more lovers
will have a lower GPA than a student who has had fewer lovers.
There is statistically significant evidence to conclude that there is a correlation between the
number of lovers students have had in their lifetimes and their GPA. Thus, the regression line is
useful.
O There is statistically insignificant evidence to conclude that there is a correlation between the
number of lovers students have had in their lifetimes and their GPA. Thus, the use of the
regression line is not appropriate.
-0.84 (Round to two decimal places)
$
071% of all students will have the average GPA.
There is a large variation in students' GPAS, but if you only look at students who have had a
fixed number of lovers, this variation on average is reduced by 71%.
4
6 2
6
2.3 2.5 3.1
O Given any group of students who have all had the same number of lovers, 71% of all of these
studetns will have the predicted GPA.
F4
O There is a 71% chance that the regression line will be a good predictor for GPA based on the
number of lovers a student has had.
do Lo
Round to 2 decimal places.
%
5
F5
A
6
MacBook Air
F6
&
7
F7
*
8
DII
F8
DD
F9
F
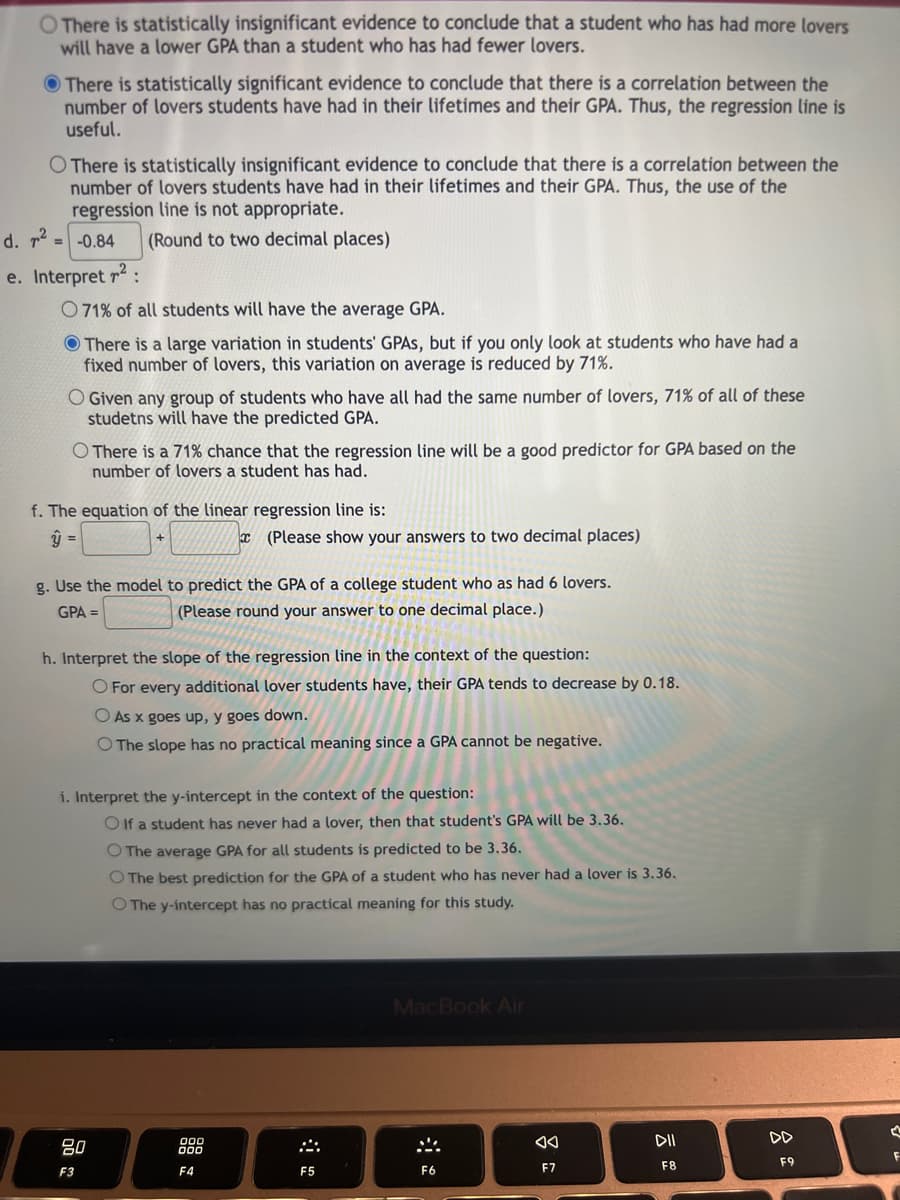
Transcribed Image Text:There is statistically insignificant evidence to conclude that a student who has had more lovers
will have a lower GPA than a student who has had fewer lovers.
There is statistically significant evidence to conclude that there is a correlation between the
number of lovers students have had in their lifetimes and their GPA. Thus, the regression line is
useful.
O There is statistically insignificant evidence to conclude that there is a correlation between the
number of lovers students have had in their lifetimes and their GPA. Thus, the use of the
regression line is not appropriate.
-0.84
(Round to two decimal places)
d. ².
=
e. Interpret ²:
071% of all students will have the average GPA.
There is a large variation in students' GPAS, but if you only look at students who have had a
fixed number of lovers, this variation on average is reduced by 71%.
O Given any group of students who have all had the same number of lovers, 71% of all of these
studetns will have the predicted GPA.
O There is a 71% chance that the regression line will be a good predictor for GPA based on the
number of lovers a student has had.
f. The equation of the linear regression line is:
y =
g. Use the model to predict the GPA of a college student who as had 6 lovers.
GPA =
(Please round your answer to one decimal place.)
(Please show your answers to two decimal places)
h. Interpret the slope of the regression line in the context of the question:
O For every additional lover students have, their GPA tends to decrease by 0.18.
O As x goes up, y goes down.
O The slope has no practical meaning since a GPA cannot be negative.
i. Interpret the y-intercept in the context of the question:
Olf a student has never had a lover, then that student's GPA will be 3.36.
O The average GPA for all students is predicted to be 3.36.
O The best prediction for the GPA of a student who
O The y-intercept has no practical meaning for this study.
80
F3
000
000
F4
F5
MacBook Air
F6
had a lover is 3.36.
8
F7
DII
F8
DD
F9
A
F
Expert Solution
This question has been solved!
Explore an expertly crafted, step-by-step solution for a thorough understanding of key concepts.

This is a popular solution!

Trending now
This is a popular solution!

Step by step
Solved in 2 steps with 2 images

Recommended textbooks for you
Glencoe Algebra 1, Student Edition, 9780079039897…
Algebra
ISBN:
9780079039897
Author:
Carter
Publisher:
McGraw Hill
Glencoe Algebra 1, Student Edition, 9780079039897…
Algebra
ISBN:
9780079039897
Author:
Carter
Publisher:
McGraw Hill