find p value?

MATLAB: An Introduction with Applications
6th Edition
ISBN:9781119256830
Author:Amos Gilat
Publisher:Amos Gilat
Chapter1: Starting With Matlab
Section: Chapter Questions
Problem 1P

Related questions
Question
find p value?
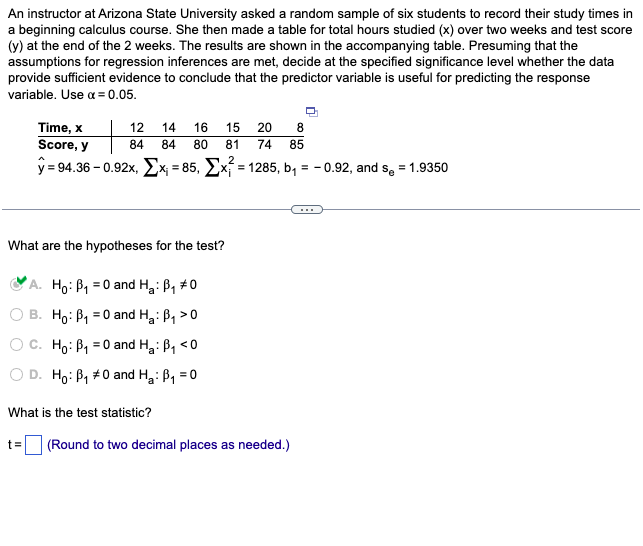
Transcribed Image Text:An instructor at Arizona State University asked a random sample of six students to record their study times in
a beginning calculus course. She then made a table for total hours studied (x) over two weeks and test score
(y) at the end of the 2 weeks. The results are shown in the accompanying table. Presuming that the
assumptions for regression inferences are met, decide at the specified significance level whether the data
provide sufficient evidence to conclude that the predictor variable is useful for predicting the response
variable. Use α = 0.05.
12 14 16 15 20
84
84 80 81 74
Time, x
Score, y
y = 94.36 -0.92x, x₁ = 85, Ex=1285, b₁ = -0.92, and s₂ = 1.9350
What are the hypotheses for the test?
A. Ho: P₁ = 0 and H₂: B₁ #0
B. Ho: B₁0 and H₂: B₁ >0
O C. Ho: B₁ = 0 and H₂: B₁ <0
D. Ho: B₁ #0 and H₂: B₁ = 0
What is the test statistic?
8
85
t= (Round to two decimal places as needed.)
Expert Solution
This question has been solved!
Explore an expertly crafted, step-by-step solution for a thorough understanding of key concepts.

Step by step
Solved in 5 steps with 29 images

Recommended textbooks for you
MATLAB: An Introduction with Applications
Statistics
ISBN:
9781119256830
Author:
Amos Gilat
Publisher:
John Wiley & Sons Inc

Probability and Statistics for Engineering and th…
Statistics
ISBN:
9781305251809
Author:
Jay L. Devore
Publisher:
Cengage Learning

Statistics for The Behavioral Sciences (MindTap C…
Statistics
ISBN:
9781305504912
Author:
Frederick J Gravetter, Larry B. Wallnau
Publisher:
Cengage Learning
MATLAB: An Introduction with Applications
Statistics
ISBN:
9781119256830
Author:
Amos Gilat
Publisher:
John Wiley & Sons Inc
Probability and Statistics for Engineering and th…
Statistics
ISBN:
9781305251809
Author:
Jay L. Devore
Publisher:
Cengage Learning
Statistics for The Behavioral Sciences (MindTap C…
Statistics
ISBN:
9781305504912
Author:
Frederick J Gravetter, Larry B. Wallnau
Publisher:
Cengage Learning

Elementary Statistics: Picturing the World (7th E…
Statistics
ISBN:
9780134683416
Author:
Ron Larson, Betsy Farber
Publisher:
PEARSON

The Basic Practice of Statistics
Statistics
ISBN:
9781319042578
Author:
David S. Moore, William I. Notz, Michael A. Fligner
Publisher:
W. H. Freeman

Introduction to the Practice of Statistics
Statistics
ISBN:
9781319013387
Author:
David S. Moore, George P. McCabe, Bruce A. Craig
Publisher:
W. H. Freeman