Fast reactions: In a study of reaction times, the time to respond to a visual stimulus (x) and the time to respond to an auditory stimulus (y) were each of 7 subjects. Times were measured in thousandths of a second. The results are presented in the following table. Visual Auditory 161 159 176 163 178 201 188 193 201 197 203 206
Fast reactions: In a study of reaction times, the time to respond to a visual stimulus (x) and the time to respond to an auditory stimulus (y) were each of 7 subjects. Times were measured in thousandths of a second. The results are presented in the following table. Visual Auditory 161 159 176 163 178 201 188 193 201 197 203 206

Functions and Change: A Modeling Approach to College Algebra (MindTap Course List)
6th Edition
ISBN:9781337111348
Author:Bruce Crauder, Benny Evans, Alan Noell
Publisher:Bruce Crauder, Benny Evans, Alan Noell
Chapter5: A Survey Of Other Common Functions
Section5.3: Modeling Data With Power Functions
Problem 6E: Urban Travel Times Population of cities and driving times are related, as shown in the accompanying...

Related questions
Question
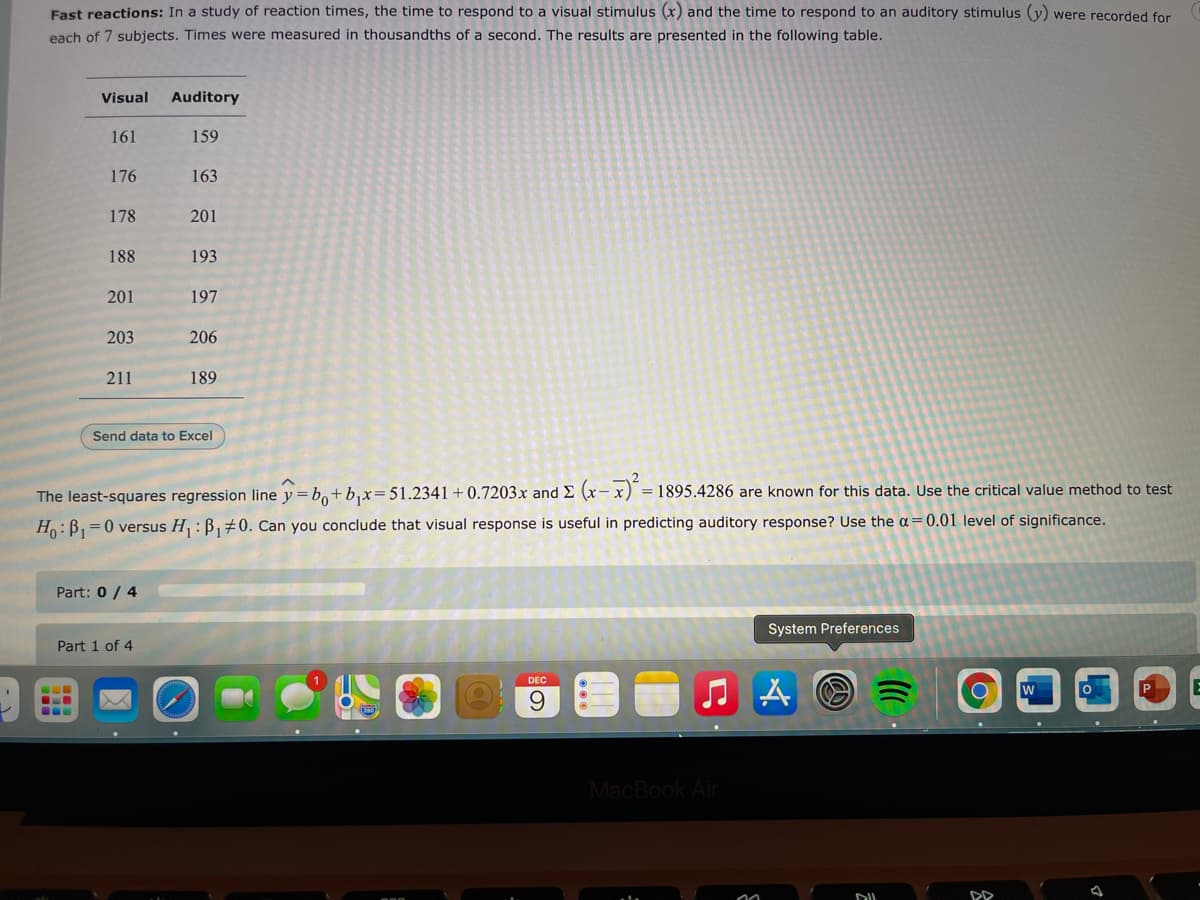
Transcribed Image Text:Fast reactions: In a study of reaction times, the time to respond to a visual stimulus (x) and the time to respond to an auditory stimulus (y) were recorded for
each of 7 subjects. Times were measured in thousandths of a second. The results are presented in the following table.
Visual
Auditory
161
159
176
163
178
201
188
193
201
197
203
206
211
189
Send data to Excel
1895.4286 are known for this data. Use the critical value method to test
The least-squares regression line y=b,+b,x= 51.2341+0.7203x and E (x-x) =
Ho:B,=0 versus H : B,#0. Can you conclude that visual response is useful in predicting auditory response? Use the a=0.01 level of significance.
Part: 0 / 4
System Preferences
Part 1 of 4
DEC
P
...
MacBook Air
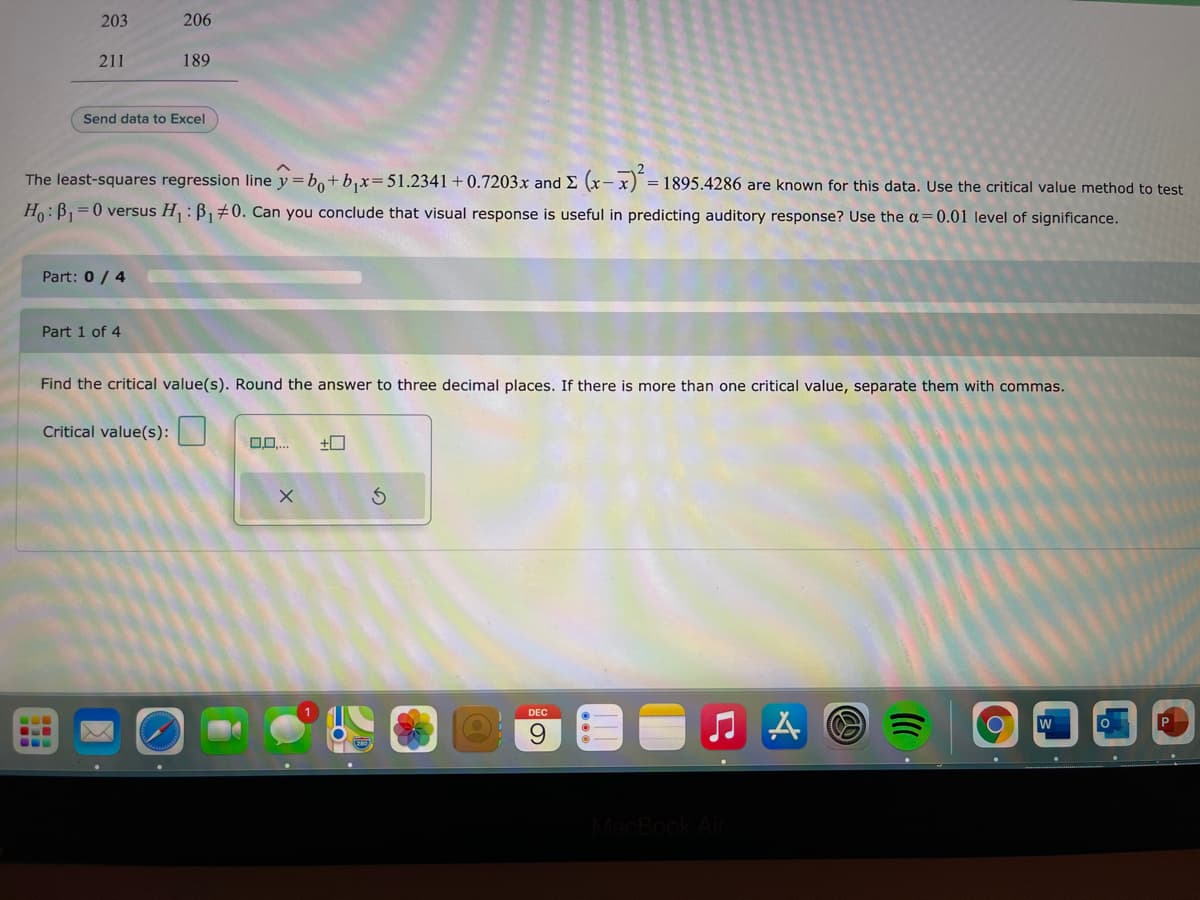
Transcribed Image Text:203
206
211
189
Send data to Excel
The least-squares regression line y = bo+ b,x=51.2341+ 0.7203x and E (x- x) = 1895.4286 are known for this data. Use the critical value method to test
H:B, =0 versus H : B,#0. Can you conclude that visual response is useful in predicting auditory response? Use the a=0.01 level of significance.
Part: 0 / 4
Part 1 of 4
Find the critical value(s). Round the answer to three decimal places. If there is more than one critical value, separate them with commas.
Critical value(s):|
DEC
w
P
cBook Air
Expert Solution
This question has been solved!
Explore an expertly crafted, step-by-step solution for a thorough understanding of key concepts.

This is a popular solution!

Trending now
This is a popular solution!

Step by step
Solved in 2 steps

Recommended textbooks for you
Functions and Change: A Modeling Approach to Coll…
Algebra
ISBN:
9781337111348
Author:
Bruce Crauder, Benny Evans, Alan Noell
Publisher:
Cengage Learning

Big Ideas Math A Bridge To Success Algebra 1: Stu…
Algebra
ISBN:
9781680331141
Author:
HOUGHTON MIFFLIN HARCOURT
Publisher:
Houghton Mifflin Harcourt

Glencoe Algebra 1, Student Edition, 9780079039897…
Algebra
ISBN:
9780079039897
Author:
Carter
Publisher:
McGraw Hill
Functions and Change: A Modeling Approach to Coll…
Algebra
ISBN:
9781337111348
Author:
Bruce Crauder, Benny Evans, Alan Noell
Publisher:
Cengage Learning
Big Ideas Math A Bridge To Success Algebra 1: Stu…
Algebra
ISBN:
9781680331141
Author:
HOUGHTON MIFFLIN HARCOURT
Publisher:
Houghton Mifflin Harcourt
Glencoe Algebra 1, Student Edition, 9780079039897…
Algebra
ISBN:
9780079039897
Author:
Carter
Publisher:
McGraw Hill