Fifty nine cities provided information on vacancy rates (in percent) in local apartments in the following frequency distribution. The sample mean and the sample standard deviation are 9% and 3.0%, respectively. (You may find it useful to reference the appropriate table: chi-square table or F table) Vacancy Rate Less than 6 Frequency 12 6 up to 9 9 up to 12 14 20 12 or more 13 a. Apply the goodness-of-fit test for normality at the 5% significance level. Do the sample data suggest that vacancy rates do not follow the normal distribution? First, select the appropriate null and alternative hypotheses. O Ho: Vacancy rates are normally distributed with a mean of 9% and a standard deviation of 3%.; HA: Vacancy rates are not normally distributed with a mean of 9% and a standard deviation of 3%. Ho: Vacancy rates are not normally distributed with a mean of 9% and a standard deviation of 3%.; HA: Vacancy rates are normally distributed with a mean of 9% and a standard deviation of 3%. b. Calculate the value of the test statistic. (Round intermediate calculations to at least 4 decimal places and final answer to 3 decimal places.) Test statistic
Fifty nine cities provided information on vacancy rates (in percent) in local apartments in the following frequency distribution. The sample mean and the sample standard deviation are 9% and 3.0%, respectively. (You may find it useful to reference the appropriate table: chi-square table or F table) Vacancy Rate Less than 6 Frequency 12 6 up to 9 9 up to 12 14 20 12 or more 13 a. Apply the goodness-of-fit test for normality at the 5% significance level. Do the sample data suggest that vacancy rates do not follow the normal distribution? First, select the appropriate null and alternative hypotheses. O Ho: Vacancy rates are normally distributed with a mean of 9% and a standard deviation of 3%.; HA: Vacancy rates are not normally distributed with a mean of 9% and a standard deviation of 3%. Ho: Vacancy rates are not normally distributed with a mean of 9% and a standard deviation of 3%.; HA: Vacancy rates are normally distributed with a mean of 9% and a standard deviation of 3%. b. Calculate the value of the test statistic. (Round intermediate calculations to at least 4 decimal places and final answer to 3 decimal places.) Test statistic

Glencoe Algebra 1, Student Edition, 9780079039897, 0079039898, 2018
18th Edition
ISBN:9780079039897
Author:Carter
Publisher:Carter
Chapter10: Statistics
Section10.4: Distributions Of Data
Problem 19PFA

Related questions
Topic Video
Question
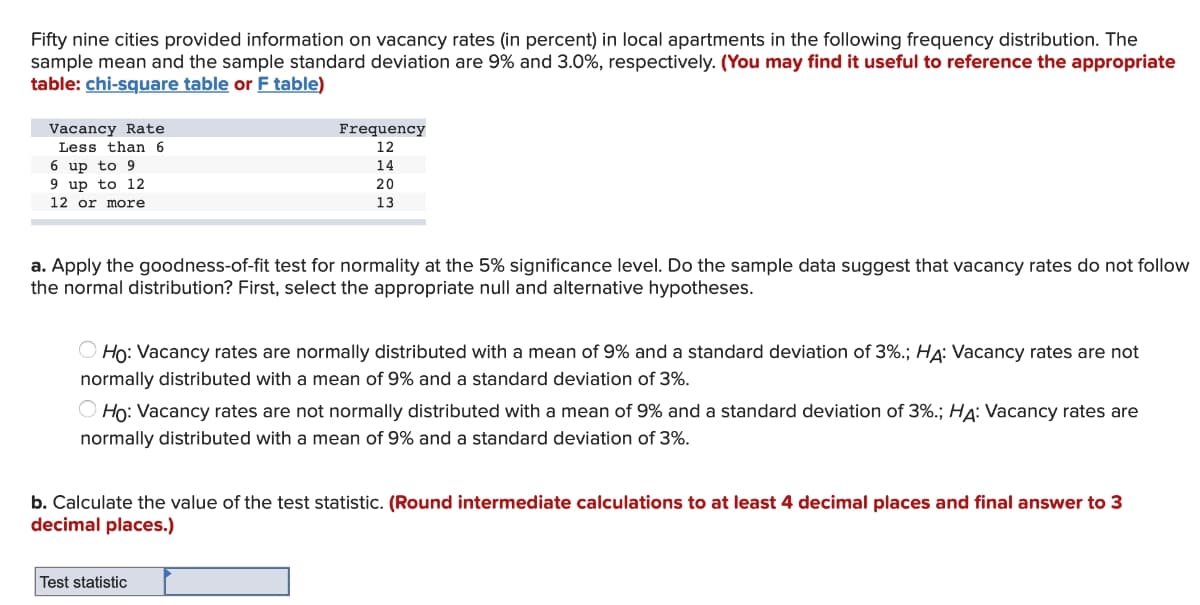
Transcribed Image Text:Fifty nine cities provided information on vacancy rates (in percent) in local apartments in the following frequency distribution. The
sample mean and the sample standard deviation are 9% and 3.0%, respectively. (You may find it useful to reference the appropriate
table: chi-square table or F table)
Vacancy Rate
Less than 6
Frequency
12
6 up to 9
9 up to 12
12 or more
14
20
13
a. Apply the goodness-of-fit test for normality at the 5% significance level. Do the sample data suggest that vacancy rates do not follow
the normal distribution? First, select the appropriate null and alternative hypotheses.
O Ho: Vacancy rates are normally distributed with a mean of 9% and a standard deviation of 3%.; HA: Vacancy rates are not
normally distributed with a mean of 9% and a standard deviation of 3%.
O Ho: Vacancy rates are not normally distributed with a mean of 9% and a standard deviation of 3%.; HA: Vacancy rates are
normally distributed with a mean of 9% and a standard deviation of 3%.
b. Calculate the value of the test statistic. (Round intermediate calculations to at least 4 decimal places and final answer to 3
decimal places.)
Test statistic
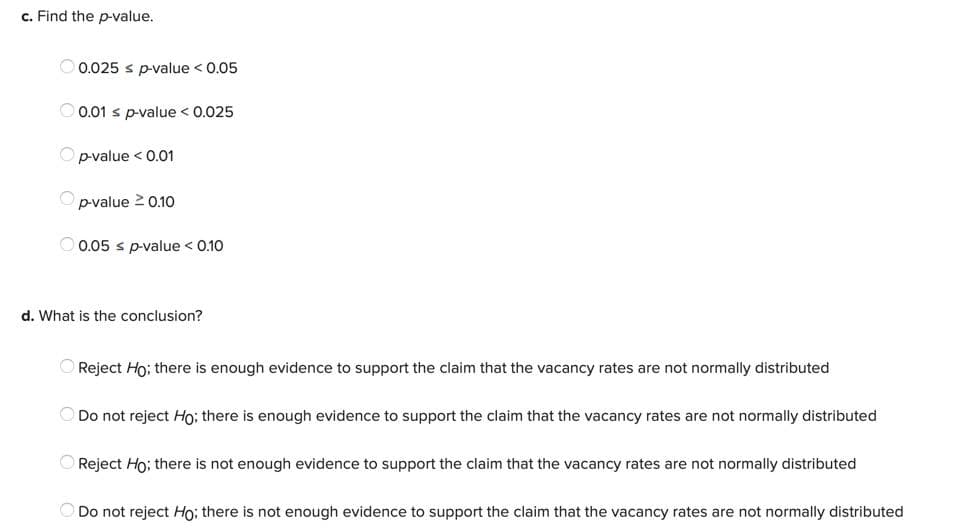
Transcribed Image Text:c. Find the p-value.
0.025 s p-value < 0.05
O 0.01 s p-value < 0.025
Opvalue < 0.01
p-value 2 0.10
O 0.05 s p-value < 0.10
d. What is the conclusion?
O Reject Ho; there is enough evidence to support the claim that the vacancy rates are not normally distributed
O Do not reject Ho; there is enough evidence to support the claim that the vacancy rates are not normally distributed
O Reject Ho; there is not enough evidence to support the claim that the vacancy rates are not normally distributed
Do not reject Ho; there is not enough evidence to support the claim that the vacancy rates are not normally distributed
Expert Solution
This question has been solved!
Explore an expertly crafted, step-by-step solution for a thorough understanding of key concepts.

This is a popular solution!

Trending now
This is a popular solution!

Step by step
Solved in 2 steps with 4 images

Knowledge Booster


Learn more about
Need a deep-dive on the concept behind this application? Look no further. Learn more about this topic, statistics and related others by exploring similar questions and additional content below.Recommended textbooks for you
Glencoe Algebra 1, Student Edition, 9780079039897…
Algebra
ISBN:
9780079039897
Author:
Carter
Publisher:
McGraw Hill
Glencoe Algebra 1, Student Edition, 9780079039897…
Algebra
ISBN:
9780079039897
Author:
Carter
Publisher:
McGraw Hill