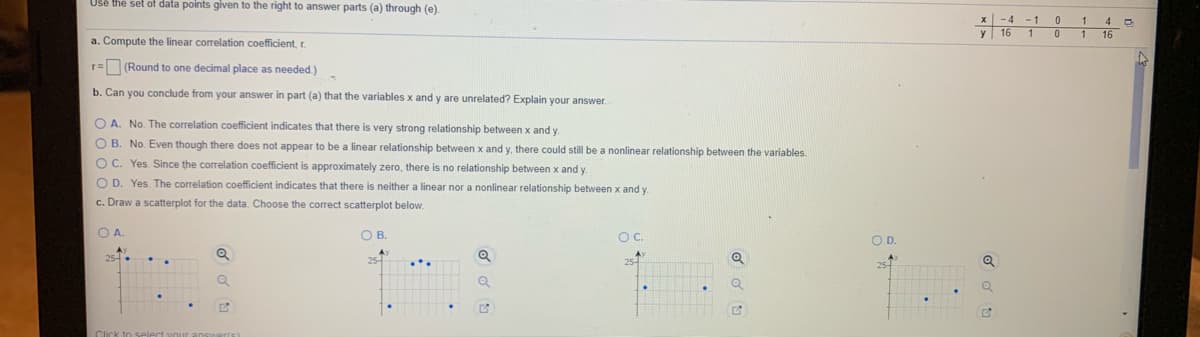
USe the set of data points given to the right to answer parts (a) through (e). -4 -1 1 y 16 4 0 1 16 a. Compute the linear corelation coefficient,r r= (Round to one decimal place as needed) b. Can you conclude from your answer in part (a) that the variables x and y are unrelated? Explain your answer. O A. No. The correlation coefficient indicates that there is very strong relationship between x and y. O B. No. Even though there does not appear to be a linear relationship between x and y, there could still be a nonlinear relationship between the variables OC. Yes. Since the correlation coefficient is approximately zero, there is no relationship between x and y O D. Yes. The correlation coefficient indicates that there is neither a linear nor a nonlinear relationship between x and y c. Draw a scatterplot for the data. Choose the correct scatterplot below. O A. OB. Oc. OD. Q


Correlation
Correlation defines a relationship between two independent variables. It tells the degree to which variables move in relation to each other. When two sets of data are related to each other, there is a correlation between them.
Linear Correlation
A correlation is used to determine the relationships between numerical and categorical variables. In other words, it is an indicator of how things are connected to one another. The correlation analysis is the study of how variables are related.
Regression Analysis
Regression analysis is a statistical method in which it estimates the relationship between a dependent variable and one or more independent variable. In simple terms dependent variable is called as outcome variable and independent variable is called as predictors. Regression analysis is one of the methods to find the trends in data. The independent variable used in Regression analysis is named Predictor variable. It offers data of an associated dependent variable regarding a particular outcome.


Trending now
This is a popular solution!

Step by step
Solved in 2 steps with 1 images


