Is there a relationship between the weight and price of a mountain bike? The following data set gives the weights and prices for ten mountain bikes. Let the expanatory variable x be the weight in pounds and the response variable y be the bike's price. Weight (LB) 32 33 29 29 34 37 28 30 34 30 Price ($) 980 350 430 710 930 160 590 530 180 1090 a. Construct a scatterplot. Interpret. b. Find the regression equation. Interpret the slope in context. Does the y-intercept have contextual meaning? c. You decide to purchase a mountain bike that weighs 33 pounds. What is the predicted price for the bike? a. Which scatterplot below correctly shows the data? A. 254001200xy A coordinate system has a horizontal x-axis labeled from 25 to 40 in increments of 1 and a vertical y-axis labeled from 0 to 1200 in increments of 50. A cluster of plotted points that form a line that falls from left to right lie between horizontal coordinates of 28 and 37 and the vertical coordinates of 160 and 590. The cluster includes (30, 1090), (32, 980), and (34, 930). B. 254001200xy A coordinate system has a horizontal x-axis labeled from 25 to 40 in increments of 1 and a vertical y-axis labeled from 0 to 1200 in increments of 50. A cluster of plotted points that form a line that falls from left to right lie between horizontal coordinates of 28 and 37 and the vertical coordinates of 160 and 590. The cluster includes (30, 350), (32, 530), and (34, 430). C. 254001200xy A coordinate system has a horizontal x-axis labeled from 25 to 40 in increments of 1 and a vertical y-axis labeled from 0 to 1200 in increments of 50. A series of plotted points loosely form a line that rises from left to right. The cluster includes (30, 430), (32, 590), and (34, 930). D. 254001200xy A coordinate system has a horizontal x-axis labeled from 25 to 40 in increments of 1 and a vertical y-axis labeled from 0 to 1200 in increments of 50. A series of plotted points loosely form a line that falls from left to right. The cluster includes (30, 710), (32, 530), and (34, 350). Click to select your answer and then click Check Answer.


Correlation
Correlation defines a relationship between two independent variables. It tells the degree to which variables move in relation to each other. When two sets of data are related to each other, there is a correlation between them.
Linear Correlation
A correlation is used to determine the relationships between numerical and categorical variables. In other words, it is an indicator of how things are connected to one another. The correlation analysis is the study of how variables are related.
Regression Analysis
Regression analysis is a statistical method in which it estimates the relationship between a dependent variable and one or more independent variable. In simple terms dependent variable is called as outcome variable and independent variable is called as predictors. Regression analysis is one of the methods to find the trends in data. The independent variable used in Regression analysis is named Predictor variable. It offers data of an associated dependent variable regarding a particular outcome.
|
Weight (LB)
|
32
|
33
|
29
|
29
|
34
|
37
|
28
|
30
|
34
|
30
|
|
|---|---|---|---|---|---|---|---|---|---|---|---|
|
Price ($)
|
980
|
350
|
430
|
710
|
930
|
160
|
590
|
530
|
180
|
1090
|
|
Regression equation is given by,
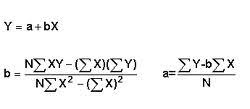
Here X= Weight and Y= price
(A). Scatter plot
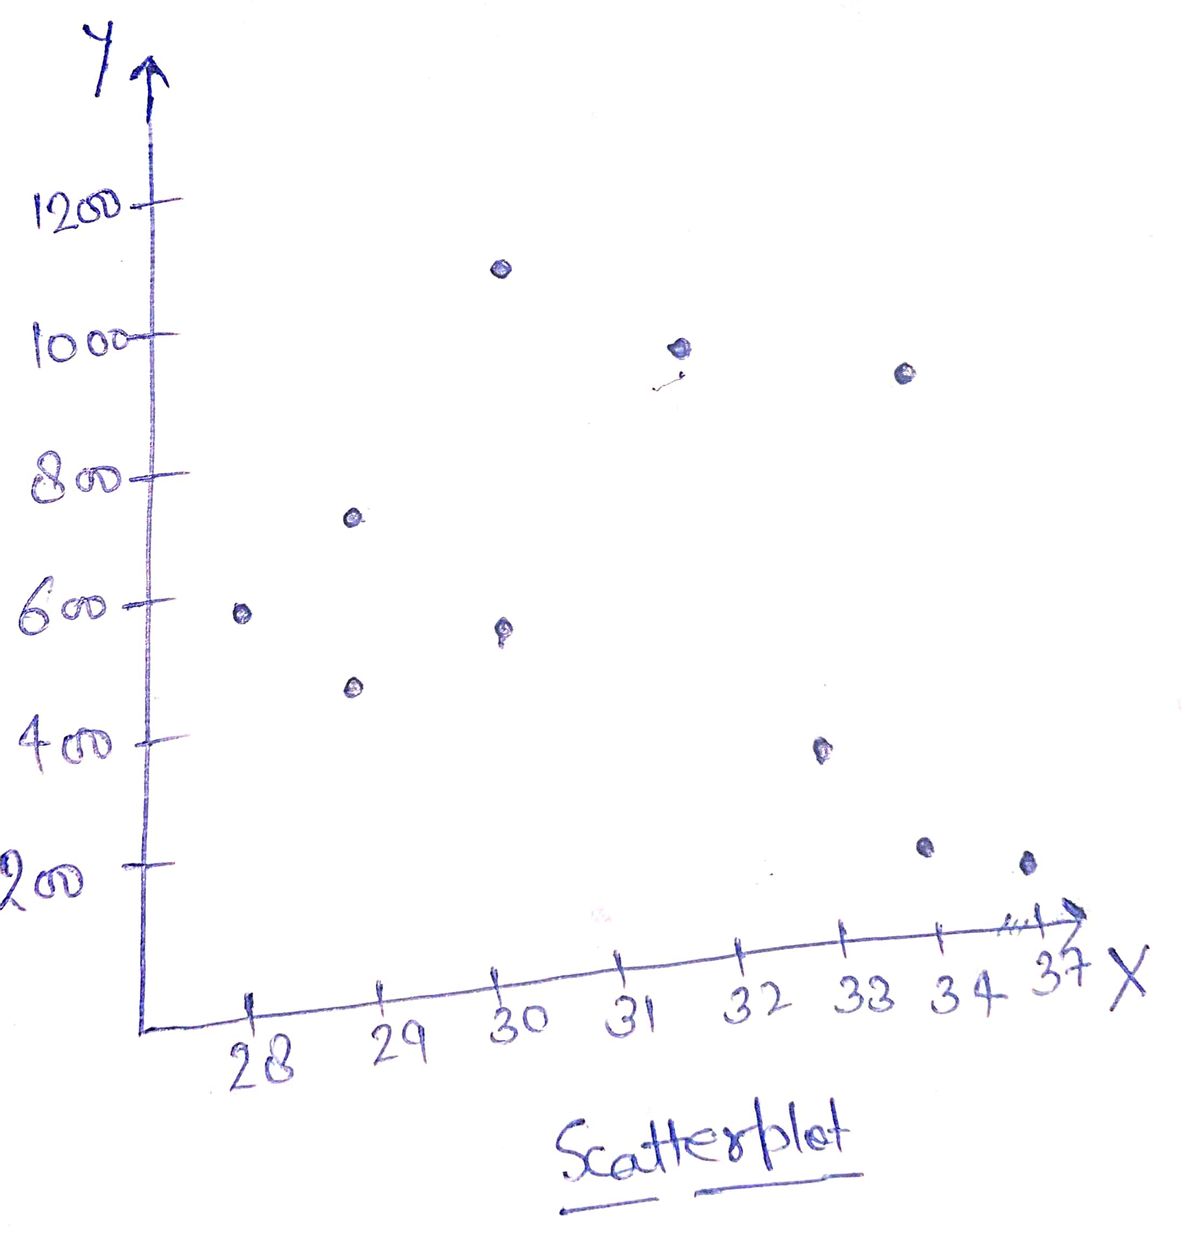
Correlation between X and Y is 0.
A scatterplot in which the points do not have a linear trend (either positive or negative) is called a zero correlation or a near-zero correlation

Trending now
This is a popular solution!

Step by step
Solved in 2 steps with 3 images


