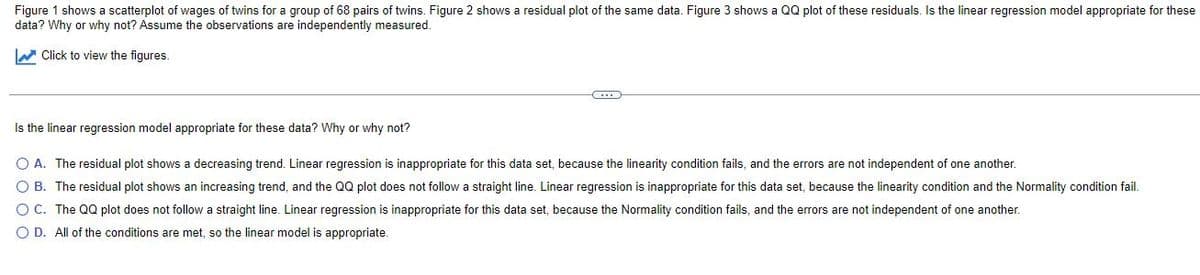
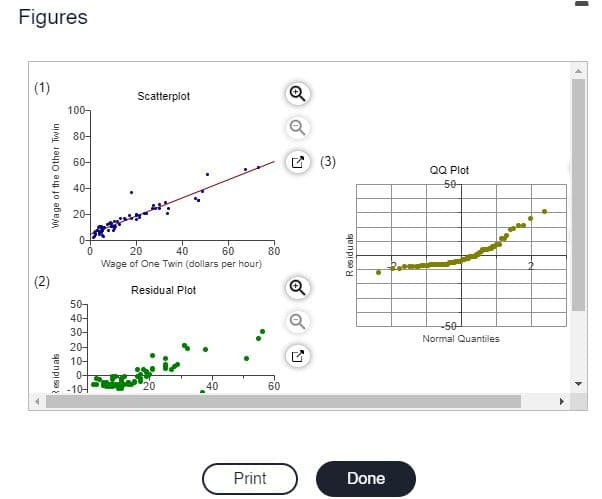
Figure 1 shows a scatterplot of wages of twins for a group of 68 pairs of twins. Figure 2 shows a residual plot of the same data. Figure 3 shows a QQ plot of these residuals. Is the linear regression model appropriate for these data? Why or why not? Assume the observations are independently measured. ✔Click to view the figures. Is the linear regression model appropriate for these data? Why or why not? O A. The residual plot shows a decreasing trend. Linear regression is inappropriate for this data set, because the linearity condition fails, and the errors are not independent of one another. OB. The residual plot shows an increasing trend, and the QQ plot does not follow a straight line. Linear regression is inappropriate for this data set, because the linearity condition and the Normality condition fail. OC. The QQ plot does not follow a straight line. Linear regression is inappropriate for this data set, because the Normality condition fails, and the errors are not independent of one another. O D. All of the conditions are met, so the linear model is appropriate.
Figure 1 shows a scatterplot of wages of twins for a group of 68 pairs of twins. Figure 2 shows a residual plot of the same data. Figure 3 shows a QQ plot of these residuals. Is the linear regression model appropriate for these data? Why or why not? Assume the observations are independently measured. ✔Click to view the figures. Is the linear regression model appropriate for these data? Why or why not? O A. The residual plot shows a decreasing trend. Linear regression is inappropriate for this data set, because the linearity condition fails, and the errors are not independent of one another. OB. The residual plot shows an increasing trend, and the QQ plot does not follow a straight line. Linear regression is inappropriate for this data set, because the linearity condition and the Normality condition fail. OC. The QQ plot does not follow a straight line. Linear regression is inappropriate for this data set, because the Normality condition fails, and the errors are not independent of one another. O D. All of the conditions are met, so the linear model is appropriate.

College Algebra
7th Edition
ISBN:9781305115545
Author:James Stewart, Lothar Redlin, Saleem Watson
Publisher:James Stewart, Lothar Redlin, Saleem Watson
Chapter1: Equations And Graphs
Section: Chapter Questions
Problem 10T: Olympic Pole Vault The graph in Figure 7 indicates that in recent years the winning Olympic men’s...

Related questions
Question
11
Transcribed Image Text:Figure 1 shows a scatterplot of wages of twins for a group of 68 pairs of twins. Figure 2 shows a residual plot of the same data. Figure 3 shows a QQ plot of these residuals. Is the linear regression model appropriate for these
data? Why or why not? Assume the observations are independently measured.
Click to view the figures.
Is the linear regression model appropriate for these data? Why or why not?
O A. The residual plot shows a decreasing trend. Linear regression is inappropriate for this data set, because the linearity condition fails, and the errors are not independent of one another.
OB. The residual plot shows an increasing trend, and the QQ plot does not follow a straight line. Linear regression is inappropriate for this data set, because the linearity condition and the Normality condition fail.
O C. The QQ plot does not follow a straight line. Linear regression is inappropriate for this data set, because the Normality condition fails, and the errors are not independent of one another.
O D. All of the conditions are met, so the linear model is appropriate.
Transcribed Image Text:Figures
(1)
2
Wage of the Other Twin
esiduals
100-
80-
60-
40-
20-
0-
50-
40-
30-
20-
10-
0-
-104
Scatterplot
20
40
60
Wage of One Twin (dollars per hour)
Residual Plot
40
80
60
Print
Q
Q
(3)
Residuals
Done
QQ Plot
-50
-50
Normal Quantiles
•
I
Expert Solution
This question has been solved!
Explore an expertly crafted, step-by-step solution for a thorough understanding of key concepts.

This is a popular solution!

Trending now
This is a popular solution!

Step by step
Solved in 2 steps

Recommended textbooks for you
College Algebra
Algebra
ISBN:
9781305115545
Author:
James Stewart, Lothar Redlin, Saleem Watson
Publisher:
Cengage Learning


Algebra & Trigonometry with Analytic Geometry
Algebra
ISBN:
9781133382119
Author:
Swokowski
Publisher:
Cengage
College Algebra
Algebra
ISBN:
9781305115545
Author:
James Stewart, Lothar Redlin, Saleem Watson
Publisher:
Cengage Learning
Algebra & Trigonometry with Analytic Geometry
Algebra
ISBN:
9781133382119
Author:
Swokowski
Publisher:
Cengage

Algebra and Trigonometry (MindTap Course List)
Algebra
ISBN:
9781305071742
Author:
James Stewart, Lothar Redlin, Saleem Watson
Publisher:
Cengage Learning

Functions and Change: A Modeling Approach to Coll…
Algebra
ISBN:
9781337111348
Author:
Bruce Crauder, Benny Evans, Alan Noell
Publisher:
Cengage Learning

Glencoe Algebra 1, Student Edition, 9780079039897…
Algebra
ISBN:
9780079039897
Author:
Carter
Publisher:
McGraw Hill