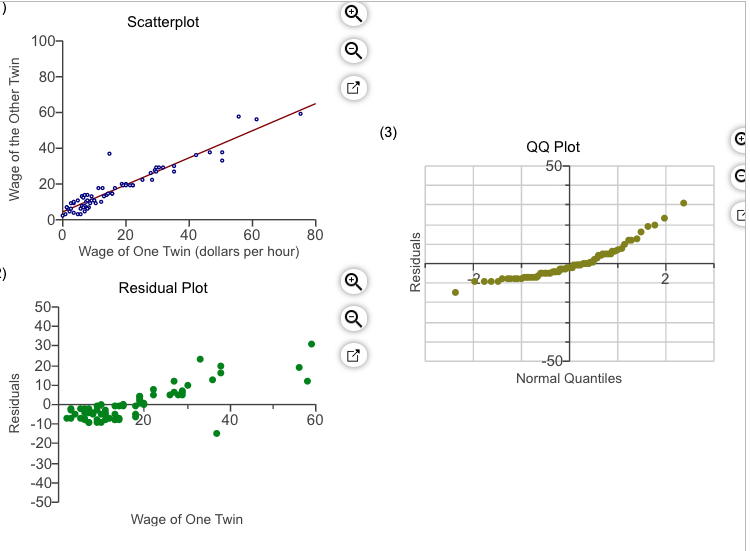
Figure 1 shows a scatterplot of wages of twins for a group of 68 pairs of twins. Figure 2 shows a residual plot of the same data. Figure 3 shows a QQ plot of these residuals. Is the linear regression model appropriate for these data? Why or why not? Assume the observations are independently measured. Is the linear regression model appropriate for these data? Why or why not? A.The residual plot shows a decreasing trend. Linear regression is inappropriate for this data set, because the linearity condition fails, and the errors are not independent of one another. B.The residual plot shows an increasing trend, and the QQ plot does not follow a straight line. Linear regression is inappropriate for this data set, because the linearity condition and the Normality condition fail. C.The QQ plot does not follow a straight line. Linear regression is inappropriate for this data set, because the Normality condition fails, and the errors are not independent of one another. D.All of the conditions are met, so the linear model is appropriate.


Correlation
Correlation defines a relationship between two independent variables. It tells the degree to which variables move in relation to each other. When two sets of data are related to each other, there is a correlation between them.
Linear Correlation
A correlation is used to determine the relationships between numerical and categorical variables. In other words, it is an indicator of how things are connected to one another. The correlation analysis is the study of how variables are related.
Regression Analysis
Regression analysis is a statistical method in which it estimates the relationship between a dependent variable and one or more independent variable. In simple terms dependent variable is called as outcome variable and independent variable is called as predictors. Regression analysis is one of the methods to find the trends in data. The independent variable used in Regression analysis is named Predictor variable. It offers data of an associated dependent variable regarding a particular outcome.
|
|


Trending now
This is a popular solution!

Step by step
Solved in 2 steps


