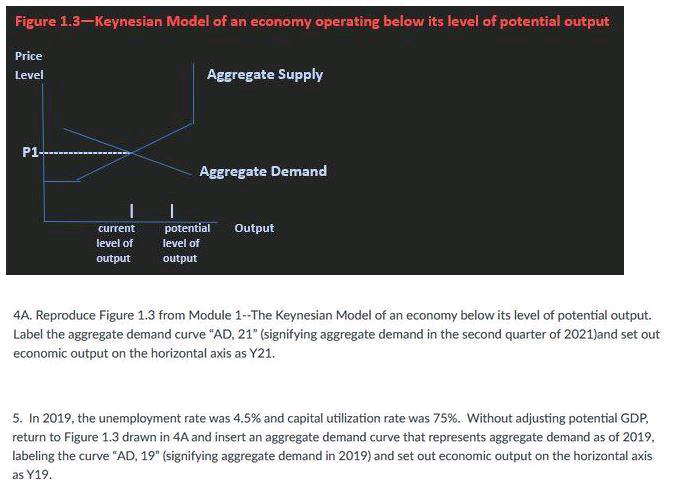
Figure 1.3-Keynesian Model of an economy operating below its level of potential output Price Level Aggregate Supply P1- Aggregate Demand current potential Output level of level of output output 4A. Reproduce Figure 1.3 from Module 1-The Keynesian Model of an economy below its level of potential output. Label the aggregate demand curve "AD, 21" (signifying aggregate demand in the second quarter of 2021)and set out economic output on the horizontal axis as Y21. 5. In 2019, the unemployment rate was 4.5% and capital utilization rate was 75%. Without adjusting potential GDP, return to Figure 1.3 drawn in 4A and insert an aggregate demand curve that represents aggregate demand as of 2019, labeling the curve "AD, 19" (signifying aggregate demand in 2019) and set out economic output on the horizontal axis as Y19.
Figure 1.3-Keynesian Model of an economy operating below its level of potential output Price Level Aggregate Supply P1- Aggregate Demand current potential Output level of level of output output 4A. Reproduce Figure 1.3 from Module 1-The Keynesian Model of an economy below its level of potential output. Label the aggregate demand curve "AD, 21" (signifying aggregate demand in the second quarter of 2021)and set out economic output on the horizontal axis as Y21. 5. In 2019, the unemployment rate was 4.5% and capital utilization rate was 75%. Without adjusting potential GDP, return to Figure 1.3 drawn in 4A and insert an aggregate demand curve that represents aggregate demand as of 2019, labeling the curve "AD, 19" (signifying aggregate demand in 2019) and set out economic output on the horizontal axis as Y19.

Chapter20: Monetary Policy
Section20.A: Policy Disputes Using The Self Correcting Aggregate Demand And Supply Model
Problem 3SQP

Related questions
Question
Please reproduce the figure. I need a graph drawn for each question.
Transcribed Image Text:Figure 1.3-Keynesian Model of an economy operating below its level of potential output
Price
Level
Aggregate Supply
P1-
Aggregate Demand
current
potential
Output
level of
level of
output
output
4A. Reproduce Figure 1.3 from Module 1-The Keynesian Model of an economy below its level of potential output.
Label the aggregate demand curve "AD, 21" (signifying aggregate demand in the second quarter of 2021)and set out
economic output on the horizontal axis as Y21.
5. In 2019, the unemployment rate was 4.5% and capital utilization rate was 75%. Without adjusting potential GDP,
return to Figure 1.3 drawn in 4A and insert an aggregate demand curve that represents aggregate demand as of 2019,
labeling the curve "AD, 19" (signifying aggregate demand in 2019) and set out economic output on the horizontal axis
as Y19.
Expert Solution
This question has been solved!
Explore an expertly crafted, step-by-step solution for a thorough understanding of key concepts.

This is a popular solution!

Trending now
This is a popular solution!

Step by step
Solved in 3 steps with 2 images

Recommended textbooks for you


Brief Principles of Macroeconomics (MindTap Cours…
Economics
ISBN:
9781337091985
Author:
N. Gregory Mankiw
Publisher:
Cengage Learning