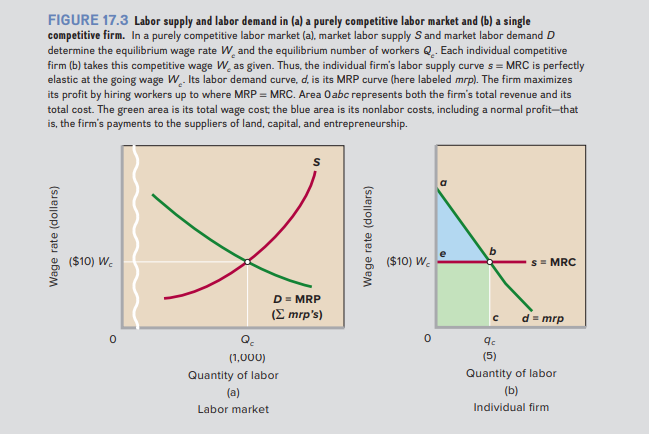
FIGURE 17.3 Labor supply and labor demand in (a) a purely competitive labor market and (b) a single competitive firm. In a purely competitive labor market (a), market labor supply S and market labor demand D determine the equilibrium wage rate W. and the equilibrium number of workers Q.. Each individual competitive firm (b) takes this competitive wage W, as given. Thus, the individual firm's labor supply curve s = MRC is perfectly elastic at the going wage W. Its labor demand curve, d, is its MRP curve (here labeled mrp). The firm maximizes its profit by hiring workers up to where MRP = MRC. Area Oabc represents both the firm's total revenue and its total cost. The green area is its total wage cost the blue area is its nonlabor costs, including a normal profit-that is, the firm's payments to the suppliers of land, capital, and entrepreneurship. ($10) W. ($10) W. S= MRC D = MRP (Σ mrps) d = mrp (1,000) (5) Quantity of labor Quantity of labor (a) (b) Labor market Individual firm Wage rate (dollars) Wage rate (dollars)


In a purely competitive labor market (a), market labor supply S and market labor demand D determine the equilibrium wage rate Wc and the equilibrium number of workers Qc . Each individual competitive firm (b) takes this competitive wage Wc as given. Thus, the individual firm’s labor supply curve s = MRC is perfectly elastic at the going wage Wc . Its labor demand curve, d, is its MRP curve (here labeled mrp). The firm maximizes its profit by hiring workers up to where MRP = MRC. Area 0abc represents both the firm’s total revenue and its total cost. The green area is its total wage cost; the blue area is its nonlabor costs, including a normal profit—that is, the firm’s payments to the suppliers of land, capital, and entrepreneurship. The supply-of-labor curve S slopes upward in graph (a) because:
a. the law of diminishing
b. the law of diminishing returns applies.
c. workers can afford to “buy” more leisure when the wage rate increases.
d. higher wages are needed to attract workers away from other labor
markets, household activities, and leisure.


Trending now
This is a popular solution!

Step by step
Solved in 2 steps


