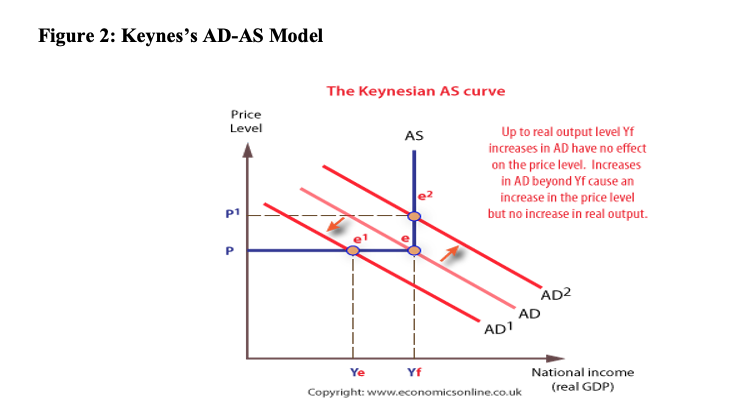
Figure 2: Keynes’s AD-AS Model(Image nomrally goes here) 2.1. Changes in which factors could cause aggregate demand to shift from AD to AD1? What could happen to the unemployment rate? What could happen to the inflation rate?(In simplier terms read and inepret the graph figure 2)


Please note that you are only helping me with 2.1 and 2.2 All the other quesitions are just for refrence if you need it. Thank you so much for your time!
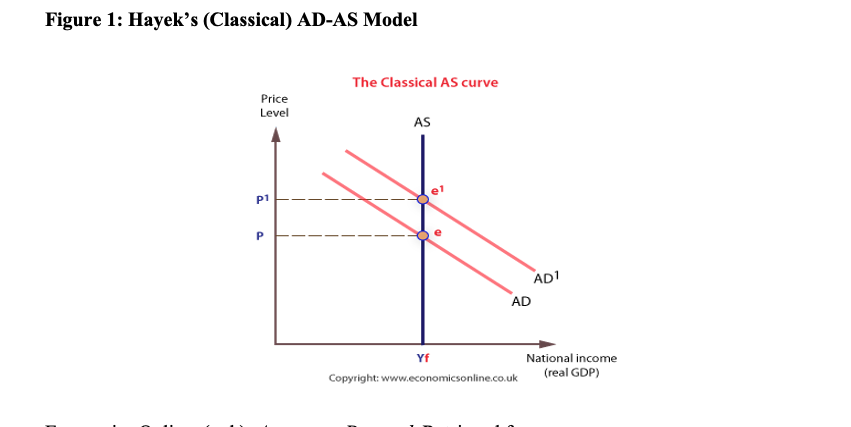
Figure 1: Hayek’s (Classical) AD-AS Model (image normally goes here)
Why does Hayek’s
- Hayek says that markets will heal themselves and that government should not intervene. How does the AD-AS model reflect Hayek’s idea that governments cannot increase real GDP beyond the level that the free market economy is able to produce?
- Do you believe that the Hayek’s classical AD-AS model explain the factors that cause changes (shifts) in AS realistically? Why or why not?
Figure 2: Keynes’s AD-AS Model(Image nomrally goes here)
2.1. Changes in which factors could cause aggregate
2.2. The Keynesian AD-AS model describes what happens with price levels when aggregate demand increases. Could you find any evidence from the last ten-fifteen years that might support AD-AS model descriptions of demand-pull inflation, cost-push inflation, and recession? For example, you could find data on the GDP’s of any two countries from 2000 to 2017 to support your findings. (Hint: this quesition is is asking for 2 countries as an example of demand pull and cost push inflation in the last 15 years.)
2.3. In
- What happens in the immediate short-run when AD rises from AD to AD2 to the price level and output?
- What happens in the short-run when AD falls from AD to AD1 to the price level and output?
- What will happen in each case in the long-run?


Trending now
This is a popular solution!

Step by step
Solved in 2 steps with 1 images


