Figure: Computing Monopoly Profit Price, marginal revenue, marginal cost, average total cost MC ATC IN MR Demand H. Quantity (per period) Reference: Ref 14-1 (Figure: Computing Monopoly Profit) If the monopolist is producing they can increase profit by A. at point H; increasing output (to point L) B. at point H; decreasing output (to point Q) C. at point L; increasing output (to point J) D. at point Q; increasing output (to point H) E. at point M; decreasing output (to point 0) P,
Figure: Computing Monopoly Profit Price, marginal revenue, marginal cost, average total cost MC ATC IN MR Demand H. Quantity (per period) Reference: Ref 14-1 (Figure: Computing Monopoly Profit) If the monopolist is producing they can increase profit by A. at point H; increasing output (to point L) B. at point H; decreasing output (to point Q) C. at point L; increasing output (to point J) D. at point Q; increasing output (to point H) E. at point M; decreasing output (to point 0) P,

Principles of Economics 2e
2nd Edition
ISBN:9781947172364
Author:Steven A. Greenlaw; David Shapiro
Publisher:Steven A. Greenlaw; David Shapiro
Chapter9: Monopoly
Section: Chapter Questions
Problem 33P: Draw a monopolists demand curve, marginal revenue, and marginal cost curves. Identify the...

Related questions

Question
Q9
Transcribed Image Text:Figure: Computing Monopoly Profit
Price, marginal
revenue, marginal
cost, average
total cost
MC
ATC
IN
MR
Demand
M
Quantity (per period)
Reference: Ref 14-1
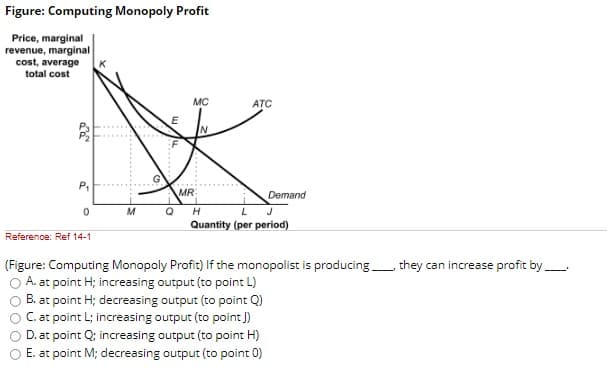
(Figure: Computing Monopoly Profit) If the monopolist is producing they can increase profit by
A. at point H; increasing output (to point L)
B. at point H; decreasing output (to point Q)
C. at point L; increasing output (to point J)
D. at point Q; increasing output (to point H)
E. at point M; decreasing output (to point 0)
Expert Solution
This question has been solved!
Explore an expertly crafted, step-by-step solution for a thorough understanding of key concepts.

Step by step
Solved in 2 steps

Knowledge Booster


Learn more about
Need a deep-dive on the concept behind this application? Look no further. Learn more about this topic, economics and related others by exploring similar questions and additional content below.Recommended textbooks for you
Principles of Economics 2e
Economics
ISBN:
9781947172364
Author:
Steven A. Greenlaw; David Shapiro
Publisher:
OpenStax


Principles of Economics 2e
Economics
ISBN:
9781947172364
Author:
Steven A. Greenlaw; David Shapiro
Publisher:
OpenStax

