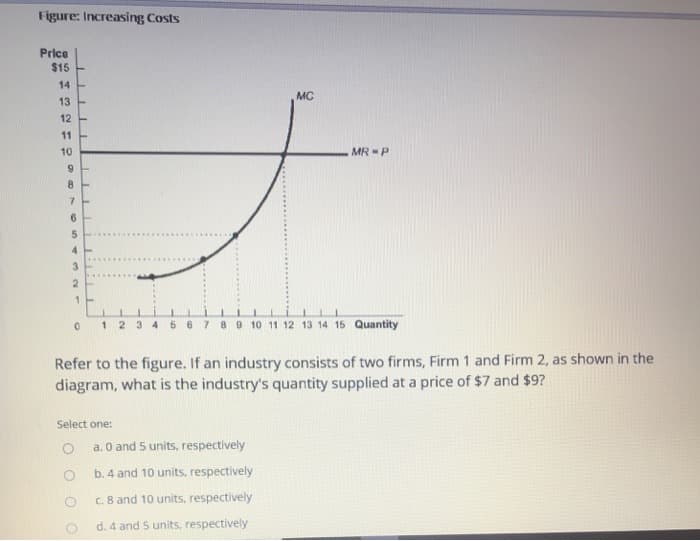
Figure: Increasing Costs Price $15 14 13 12 11 10 7 6 4 2 1- 0 MC 1 2 3 4 6 6 7 8 9 10 11 12 13 14 15 Quantity Select one: MR P Refer to the figure. If an industry consists of two firms, Firm 1 and Firm 2, as shown in the diagram, what is the industry's quantity supplied at a price of $7 and $9? a. 0 and 5 units, respectively b. 4 and 10 units, respectively c. 8 and 10 units, respectively d. 4 and 5 units, respectively


Q: culate the elasticity of demand when the price of a coffee rises from $4 to $6 a cup. what price is…
A: In economics, demand refers to the quantity of a good or service that consumers are willing and able…
Q: Related to the Economics in Practice on p. 156: According to the "paradox of thrift," as individuals…
A: The paradox of thrift is an economic theory that states that the increase in saving will result in…
Q: 2. Shifts in a budget constraint Nick brings $25 to a baseball game to spend on sodas and pizza. The…
A: A budget constraint is the limit on the total amount of money a person or organization can spend,…
Q: In the economy of Robberia, the monetary base is $2300. People hold 30% of their money in the form…
A: Monetary base = $2300People hold 30% of their money in the form of currency. People hold 70% of…
Q: The demand for coffee is dependent on demand and supply changes in other markets and other…
A: Substitute goods are those types of goods which are consumed in place of one another. For eg, tea…
Q: 1. Calculate the trade-to-GDP ratios for the two countries and answer the following questions. a.…
A: The trade-to-GDP ratio is a measure that explains the importance of international trade to a…
Q: Output Total Fixed Cost (TFC) Total Variable Cost (TVC) Total Cost (TC) Average Fixed Cost (AFC)…
A: Total cost is the sum of fixed cost and variable cost.=> TC = FC + VC Fixed cost is the cost that…
Q: George Kyparisis owns a company that manufactures sailboats. Actual demand for George's sailboats…
A: Demand refers to the quantity of a good or service that consumers are willing and able to buy at a…
Q: A firm operating in a perfectly competitive market has a total cost function:…
A: A competitive market, also known as a perfectly competitive market, is a market structure…
Q: QUESTION 18 Exhibit 19-6 Price of Good X * Quantity of Good X Refer to Exhibit 19-6. Suppose the…
A: In the given diagram, there are three equilibrium quantities, which include 700, 800, and 900, and…
Q: Which of these would be associated with perfect competition in a market? Question 7 options: a) a…
A: “Since you have posted multiple questions, we will provide the solution only to the first question…
Q: Suppose a monopoly's inverse demand curve is P = 100-Q, it produces a product with a constant…
A: Inverse demand equation: Marginal cost MC=$20Fixed cost =0A monopoly is the sole producer in the…
Q: Given the balance sheet of BSP Bank as follows: Liabilities Deposits 30000 Assets Reserves 25000…
A: As central banks make monetary policy decisions, they actively monitor company expectations in order…
Q: Figure 13.2. The U.S. Market for Imported Toyotas MR D Q₂Q Imported Toyotas MC₂ MC₂ In Figure 13.2,…
A: The study and evaluation of corporate financial concerns using abstract economic concepts and ideas…
Q: Refer to Figure 1. The optimum amount of this product from society's standpoint would be Figure 1…
A: An externality is a side effect or consequence of an economic activity that affects parties who did…
Q: 10. The distribution of income is correlated with the distribution of human capital. A) True B)…
A: Human capital alludes to the aggregate abilities, knowledge, experience, and capacities moved by…
Q: 1) If a firm carns normal profit, then it has generated revenues a. equal to the sum of implicit and…
A: “Since you have posted multiple questions, we will provide the solution only to the first question…
Q: Last year, real GDP per person was $4,200. The year before it was $4,000. By what percentage did…
A: Last year, real GDP per person was $4200. A year before, real GDP per person was $4000.
Q: The market for pizza has the following demand and supply schedules: Price Quantity Demanded…
A: A state of balance in the market where the supply of a particular good or service (here, pizzas)…
Q: ecision at the margin is a hard-working college sophomore. One Thursday, she decides to work nonstop…
A: Rational individuals think at the margin. In order to choose the optimum course of action, people…
Q: If banks increase excess reserves to increase their ability to absorb a higher rate of defaults:…
A: A concept known as the "money multiplier" calculates how much money banks generate from deposits…
Q: Question 4 Monopolistic competitive firms share some characteristics with perfectly competitive…
A: Perfectly competitive firm: It is characterized by a huge number of buyers and sellers, keeping…
Q: Which of the following is true? A pegged exchange rate is tied to gold A soft peg is fixed…
A: Pegged Exchange Rate:A pegged exchange rate is a type of exchange rate regime where a country's…
Q: Which of the following is true regarding arbitrage? It involves simultaneous transactions in two or…
A: An investor uses the investment strategy of arbitrage to purchase and sell an asset at the same time…
Q: Price Level 110 100 A C 900 960 AS1 B 1100 AD2 AD1 Real GDP FIGURE 23-5 Refer to Figure 23-5.…
A: In general, a multiplier is an economic element that, when raised or lowered, raises or lowers…
Q: The demand function is described by the equation qip)-130-p/5. The inverse demand function is…
A: A demand function is a mathematical expression that shows the relationship between the quantity of a…
Q: A loan is repaid by making payments of $5000.00 at the end of every six months for fourteen years.…
A: Periodic payment (A) = $5000.00Length of each period = 6 months or half a year.Nominal rate of…
Q: 1) please illustrate these events in the copper market in the demand-and supply diagram and also…
A: Demand curve represents the quantity demanded corresponding to different price level. Demand curve…
Q: Conceptual Analysis Using the figure, match the last two column and fill in the blanks with…
A: Production possibilities frontier shows different combinations of two goods an economy can produce…
Q: When new entrants into a competitive market have higher costs than existing firms, X A. accounting…
A: Competitive market refers to a market condition where there are many buyers and many sellers in the…
Q: The figure below shows the market for fish Please classify the effect of each of the following as…
A: Change in quantity demanded occurs due to a change in the price of the goods. This is shown by the…
Q: Assume that the parcels are essentially identical and that the minimum selling price of each is…
A: Given:Minimum selling price before =$400000New minimum selling price = $360000
Q: Use the information in the table below to compute Susan's income elasticity of demand for business…
A: Income elasticity of demand measures the responsiveness of quantity demanded to change in income.…
Q: Use the table below to answer the following questions. a. Calculate the growth rate of real GDP for…
A: The growth rate of Real GDP is a measure of how quickly the economy is expanding or contracting over…
Q: Capital goods Figure 1 A B C . D Consumer goods Refer to Figure 1. At point A, the opportunity cost…
A: The value of the next best choice that must be given up or sacrificed when a decision is made to…
Q: If You-Will-Never-Pay-It-Off Loan Company lends you $150 on Monday, and you have to pay $250 after…
A: The term "effective interest rate" (EIR) refers to the rate used to determine the true return on…
Q: The following graph shows the production possibilities frontier for publicly provided goods and…
A: PPF is the production possibility frontier.PPF shows the production possibility of two goods in an…
Q: Assume that, in response to a wage increase, Professor C retires sooner. a. (4) Explain - VERY…
A: Substitution effect:The substitution effect describes the change in consumption or labor choices…
Q: QUESTION 2 Quantity 1 45 2 3 6 7 8 9 Price 5 5 5 5 5 5 5 5 5 price and quantity relationship in the…
A: A market is a place where goods are sold and bought by theproducers and consumers. It transacts the…
Q: A monopoly is considering selling several units of a homogeneous product as a single package.…
A: A monopoly is a single firm in the market producing unique good.
Q: 3. The relationship between marginal and average costs Consider the following scenario to understand…
A: The addition of any unit in the production process requires some cost is known marginal cost. The…
Q: 4. Suppose the market demand and supply functions are Qp = 112,500-150P and Qs 125P+ 49,250. You…
A:
Q: A number of coal burning steam locomotives pass by several largely populated towns each day spewing…
A: The Coase Theorem is an economic theory that suggests that if property rights are well-defined and…
Q: If the current price of a product is above the market equilibrium price, there is OA. excess demand,…
A: Disequilibrium in economics refers to a state of imbalance in a market where the quantity supplied…
Q: Other regarding preferences are ones where The decision maker considers their interests and the…
A: Preferences, in the context of economics and decision theory, refer to an individual's or a group's…
Q: 8 Price (dollars per CD 30 20 10 $ tax on seller X 0 10 20 30 40 50 60 70 80 Quontity (millions of…
A: When a tax is imposed, the ss(supply curve) shifts to the left or it decreases as now the cost of…
Q: 5. Illustrate how each of the following affects the price and quantity of euro (€) using an exchange…
A: Exchange rate is the price of currency of one country which is expressed in terms of the currency of…
Q: un Use the graph to the right to answer the following questions (assume that each event takes places…
A: Disclaimer- “Since you have asked multiple questions, we will solve the first three questions for…
Q: You are a monopolist serving a single market but you have 2 different factories. The market demand…
A: A monopolistic market, often referred to simply as a monopoly, is a market structure characterized…
Q: In a Keynesian cross diagram, if the government decreases the tax rate, or makes the leakage of…
A: Keynesian economics is a macroeconomic hypothesis that stresses the job of aggregate demand in…


Trending now
This is a popular solution!

Step by step
Solved in 3 steps with 1 images


- Assumed that the demand (D) for potato given by demand: Q = 1500 − 15P, where Q isquantity per month measured in kilos and P is price per kilo. 1. Supply is equals to 900 kilos one day, what will the price be?2. Supply were to fall to 300 kilos, what would the price be?3. The D for Potato shifts outward to Q = 2100 − 15P, what will be answer in part 1 and 2 change?4. Graph the resultsSubject: Economics 1.) The demand equation for the Drake GPS Navigator is x + 4p − 1070 = 0, where x is the quantity demanded per week and p is the wholesale unit price in dollars. The supply equation x − 19p + 1000 = 0, where x is the quantity, the supplier will make available in the market each week when the wholesale price is p dollars each. Find the equilibrium quantity and the equilibrium price for the GPS Navigators. (a) equilibrium quantity= units(b) equilibrium price $=Please no written by hand and no image 6. The supply of wheat is given by the following equation: Qw=-6+4Pw-2PC-PF W where Q is the quantity of wheat supplied, in millions of bushels; Pw is the price of wheat per bushel; Pc is the price of corn per bushel; and P, is the price of tractor fuel per gallon. F a. Graph the inverse supply curve when corn sells for $4 a bushel and fuel sells for $2 a gallon. What is the supply choke price? b. How much wheat will be supplied at a price of $4? $8? c. What will happen to the supply of wheat if the price of corn increases to $6 per bushel? Explain intuitively; then graph the new inverse supply carefully and indicate the new choke price. d. Suppose instead that the price of corn remains $4, but the price of fuel decreases to $1. What will happen to the supply of wheat as a result? Explain intuitively; then graph the new inverse supply. Be sure to indicate the new choke price.
- 1. Caribbean economies tend to rely heavily on the Tourism sector, offering Sun, Sea andSand as the “tourism product” for which tourists purchase hotel accommodationsto enjoy. Hoteliers offer these services and are therefore major “suppliers” in thismarket.In 2017 however, several natural disasters affected the Caribbean, resulting ineconomic, environmental and human losses. In order to analyze the impact ofthese Natural Disasters on the hotel industry, answer the following questions. a. With the use of an appropriate demand and supply diagram for hotel rooms(accommodation), illustrate and explain how the news of an impending Tropical Stormto the Caribbean region would affect the market price (hotel rates) and quantity tradedof hotel rooms.b. Following the destruction of hotel infrastructure from the passage of the Hurricanes, usean appropriate demand and supply diagram for hotel rooms (accommodations) toillustrate and explain the impact of the Hurricanes on the market price and…urgent Question 3.Assume that a Swiss drug company holds the patent on a malaria medicine that has no closesubstitutes. If it charges the same price in every country where it sells this medicine, a price thatwill maximize its profits, that price will exceed what the vast majority of consumers in twentylower-income countries can afford to pay.a) Illustrate this situation using supply and demand curves.b) Use supply and demand curves to show how the Swiss company can sell at different prices ineach country and make a profit in each. Identify on the curves the profit the Swiss companymakes in a typical poorer country, and the profit it makes in a wealthier country.c) What condition is necessary for the Swiss company to be able to follow this strategy?use diagramsa. What is the effect on the equilibrium price and quantity traded in market of theintroduction of a new technology that reduces costs of production for all firms?b. What is the effect on the equilibrium price and quantity traded in a market of a changein tastes that reduces the demand for the product?c. What is the effect on the equilibrium price and quantity traded in a market of theimposition of a tax per unit sold on suppliers?d. What is the effect on the equilibrium price and quantity traded in a market of thepayment of a subsidy per unit sold paid to suppliers?
- Chapter 2 Problem #5. Suppose the demand and supplycurves for a product are given by QD= 500 −2PQS=−100 + 3Pa. Graph the supply and demand curves.b. Find the equilibrium price and quantity.Qd= Q3500-2P= -100+3PP= Pe = 120 & Qe=260The equilibrium price is $120 and the quantity is 260c. If the current price of the product is $100, what is thequantity supplied and the quantity demanded? How would you describe thissituation, and what would you expect to happen in this market?d. If the current price of the product is $150, what is thequantity supplied and the quantity demanded? How would you describe thissituation, and what would you expect to happen in this market?e. Suppose that demand changes to QD= 600 – 2P.Find the new equilibrium price and quantity, and show this on your graph.***PLEASE SHOW ALL EQUATIONS AND METHODS,Suppose that the demand and supply schedules for raisins in South Carolina are as fallows, quantitiesare measured in millions of packs per month. What is the quantity of raisins bought if the price is 50cents ? Price (cents per pack) Quantity demanded20 18030 16040 14050 12060 10070 8080 60 a) 120b) 180c) 100Question#4Given below is the Supply Schedule of Nestle Milk per liter: Price of Milk per liter (in Rs) 100 200 300 400Quantity Supplied per day in liters (in 1000s) 100 200 300 400 A) Use above data to illustrate the Supply Curve in a graph with complete labels.B) Assume Rs. 200 is the original price of milk per liter and 200,000 liters is the original quantity of supply.C) Suppose the price rises from Rs. 200 to Rs. 300, what will be the amount of Quantity Supplied?D) Illustrate the impact of (C) on the graph.E) Is this a movement along the supply curve or shift of the curve?
- The table below shows the demand and supply for soybean in Anderson County, South Carolina. A) Graph the demand and supply curves below and indicate the equilibrium price and quantity. B) Based on the market equilibrium above, compute the total income of soybean growers in the region. Supply Price Demand 60 4 150 80 8 140 100 12 130 120 16 120 140 18 110Give typing answer with explanation and conclusion 5.)What happens if a government imposes price controls that require a selling price that is BELOW the equilibrium price? A. A SHORTAGE results—a shortage then puts a pressure on prices to DROP B. A SHORTAGE results—a shortage then puts a pressure on prices to RISE C. A SURPLUS results—a surplus then puts a pressure on prices to DROP D. A SURPLUS results—a surplus then puts a pressure on prices to RISEHow has the demand for the smart phones affected the demand and supply of digital cameras? Are digital cameras likely to face the same fate as the desktops for laptops? Discuss in detail the how mega players like Sony and Samsung have cut their Digital camera production and supply to meet the rising demand of smart phones in the world market. (100-150 words)