Which of the following is TRUE? Residuals are also called as errors. O b. The errors in a regression model are assumed to have increasing variance
Which of the following is TRUE? Residuals are also called as errors. O b. The errors in a regression model are assumed to have increasing variance

Chapter6: Exponential And Logarithmic Functions
Section6.8: Fitting Exponential Models To Data
Problem 5SE: What does the y -intercept on the graph of a logistic equation correspond to for a population...

Related questions
Question
100%
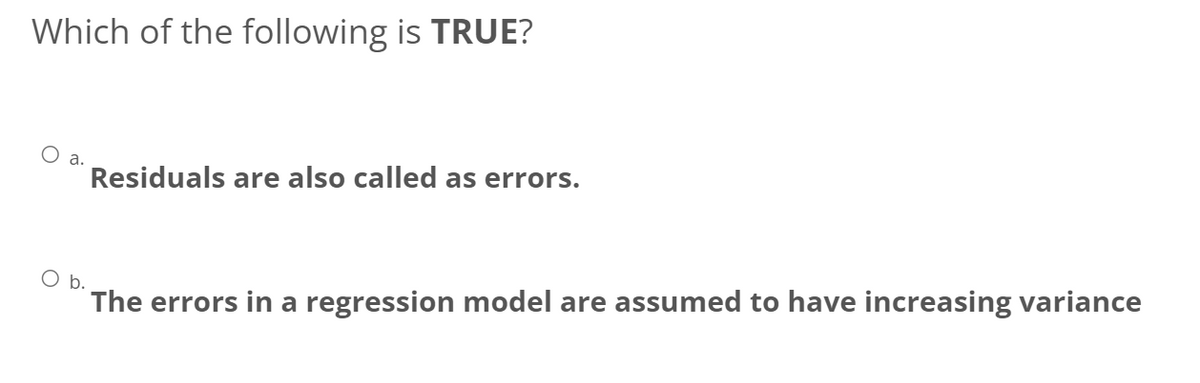
Transcribed Image Text:Which of the following is TRUE?
Residuals are also called as errors.
O b.
The errors in a regression model are assumed to have increasing variance
Expert Solution
This question has been solved!
Explore an expertly crafted, step-by-step solution for a thorough understanding of key concepts.

Step by step
Solved in 2 steps

Recommended textbooks for you

Glencoe Algebra 1, Student Edition, 9780079039897…
Algebra
ISBN:
9780079039897
Author:
Carter
Publisher:
McGraw Hill

Algebra & Trigonometry with Analytic Geometry
Algebra
ISBN:
9781133382119
Author:
Swokowski
Publisher:
Cengage
Glencoe Algebra 1, Student Edition, 9780079039897…
Algebra
ISBN:
9780079039897
Author:
Carter
Publisher:
McGraw Hill
Algebra & Trigonometry with Analytic Geometry
Algebra
ISBN:
9781133382119
Author:
Swokowski
Publisher:
Cengage

College Algebra
Algebra
ISBN:
9781305115545
Author:
James Stewart, Lothar Redlin, Saleem Watson
Publisher:
Cengage Learning