Fill in the table below. That is, calculate equilibrium price and quantity, producer, consumer and social surplus. Show your answers also graphically in Excel. Beer market Equilibrium Price Equilibrium Quantity Consumer Surplus Producer Surplus Social Surplus Question 3.2 Is there any deadweight loss in such market? Briefly motivate your answer, also by explaining the economic meaning of deadweight loss.
Fill in the table below. That is, calculate equilibrium price and quantity, producer, consumer and social surplus. Show your answers also graphically in Excel. Beer market Equilibrium Price Equilibrium Quantity Consumer Surplus Producer Surplus Social Surplus Question 3.2 Is there any deadweight loss in such market? Briefly motivate your answer, also by explaining the economic meaning of deadweight loss.

Chapter4: Markets In Action
Section: Chapter Questions
Problem 1SQP

Related questions

Question
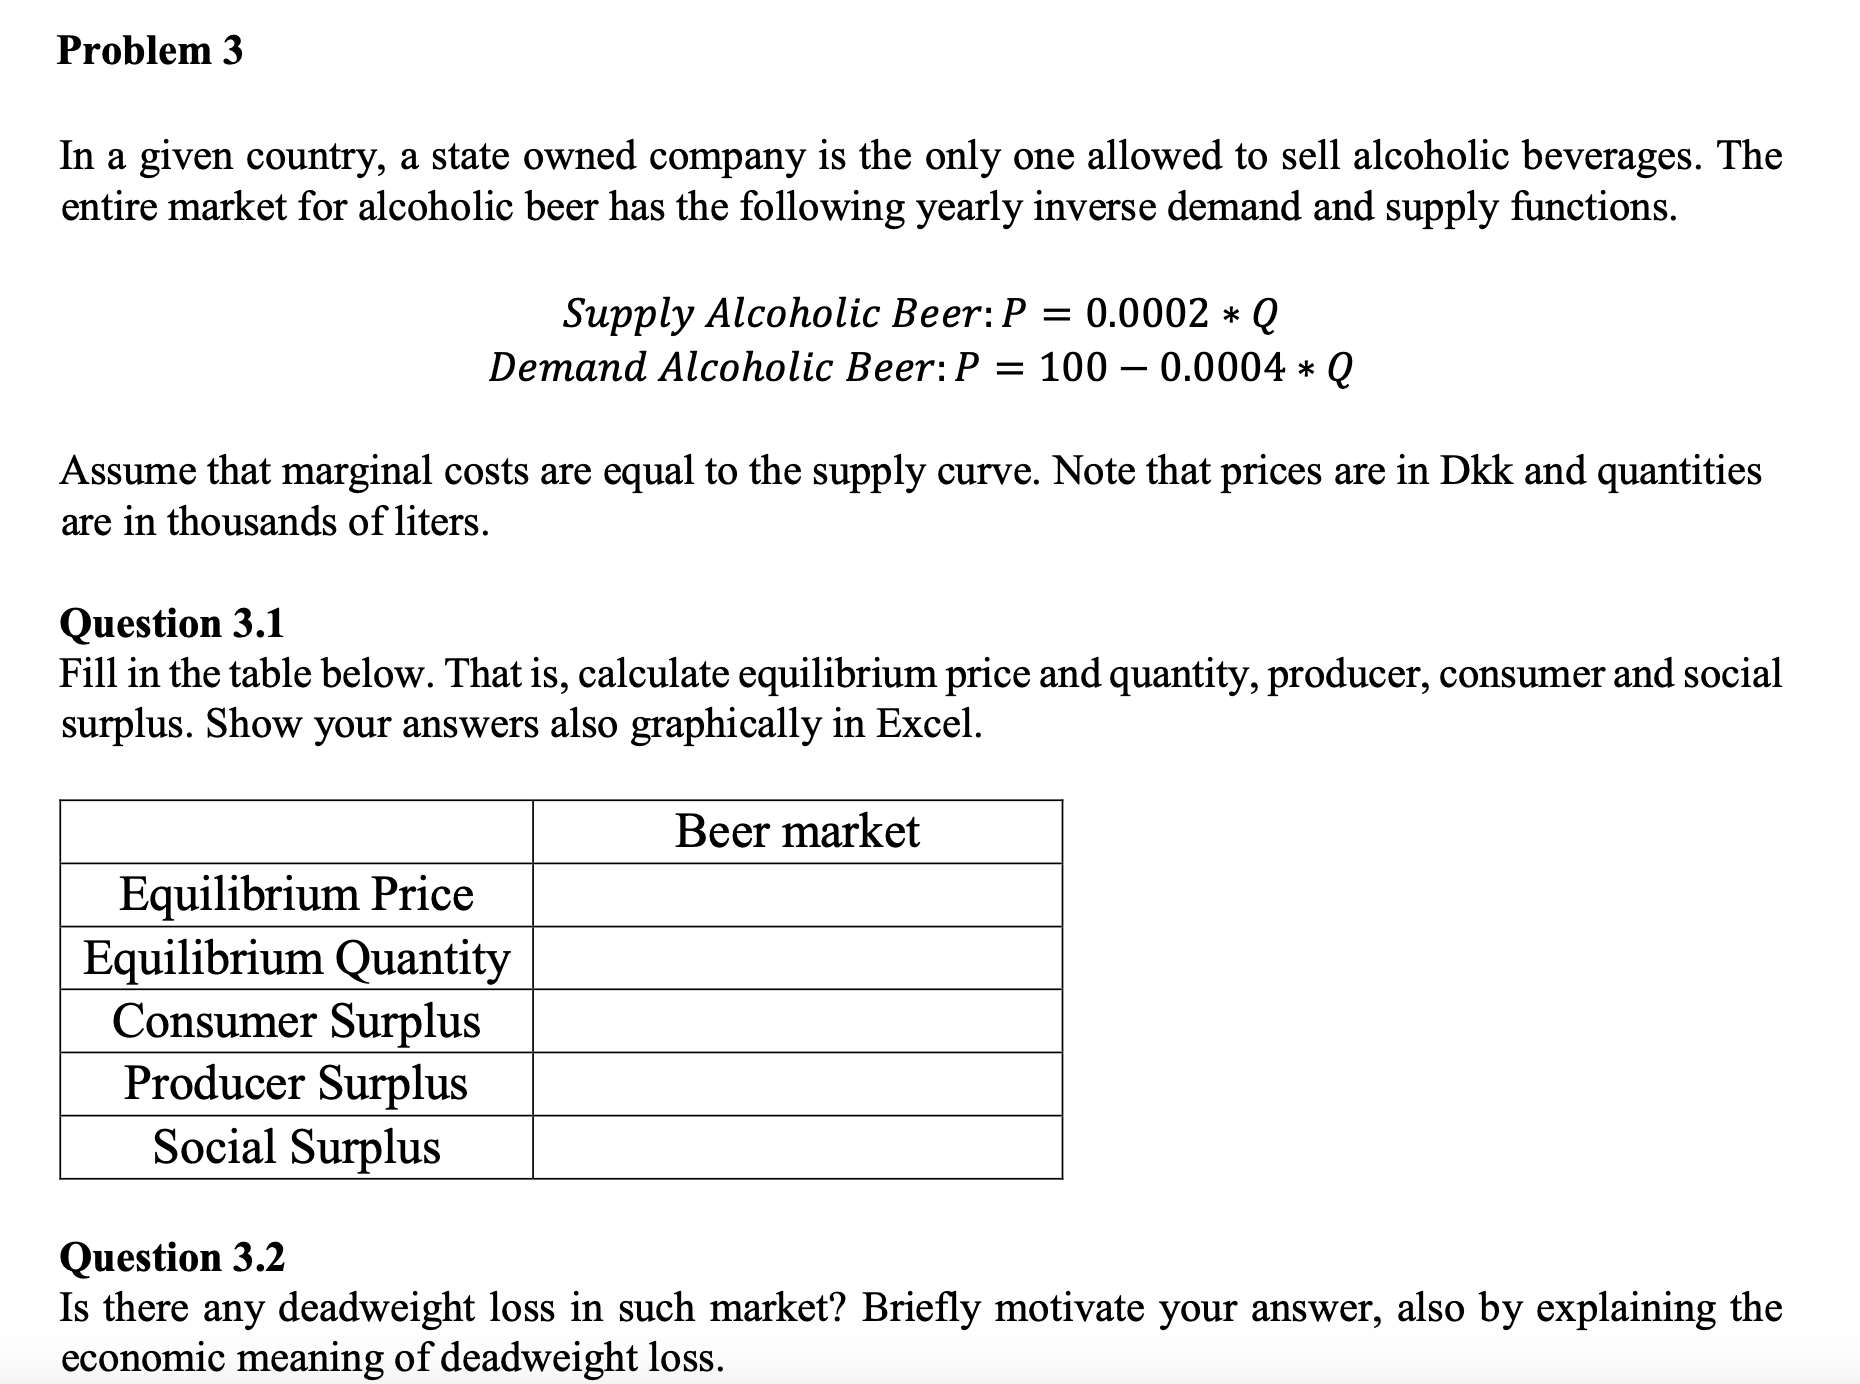
Transcribed Image Text:Fill in the table below. That is, calculate equilibrium price and quantity, producer, consumer and social
surplus. Show your answers also graphically in Excel.
Beer market
Equilibrium Price
Equilibrium Quantity
Consumer Surplus
Producer Surplus
Social Surplus
Question 3.2
Is there any deadweight loss in such market? Briefly motivate your answer, also by explaining the
economic meaning of deadweight loss.
Expert Solution
This question has been solved!
Explore an expertly crafted, step-by-step solution for a thorough understanding of key concepts.

This is a popular solution!

Trending now
This is a popular solution!

Step by step
Solved in 4 steps with 6 images

Knowledge Booster


Learn more about
Need a deep-dive on the concept behind this application? Look no further. Learn more about this topic, economics and related others by exploring similar questions and additional content below.Recommended textbooks for you


Exploring Economics
Economics
ISBN:
9781544336329
Author:
Robert L. Sexton
Publisher:
SAGE Publications, Inc

Economics (MindTap Course List)
Economics
ISBN:
9781337617383
Author:
Roger A. Arnold
Publisher:
Cengage Learning
