On the following graph, use the black point (cross symbol) to indicate the equilibrium price and quantity of computer keyboards. Then use the green point (triangle symbol) to fill the area representing consumer surplus, and use the purple point (diamond symbol) to fill the area representing producer surplus. Hint: Clicking a shaded area, after plotting it on the graph, will show you the total area of the shaded region. The Supply and Demand for Computer Keyboards Demand Equilibrium A Consumer Surplus ◇ Producer Surplus PRICE (Dollars per keyboard) 300 270 240 210 160 150 120 90 60 30 0 Supply 0 10 20 30 60 50 40 60 70 QUANTITY (Keyboards) Total net benefit (or total surplus) in this market is s 90 100
On the following graph, use the black point (cross symbol) to indicate the equilibrium price and quantity of computer keyboards. Then use the green point (triangle symbol) to fill the area representing consumer surplus, and use the purple point (diamond symbol) to fill the area representing producer surplus. Hint: Clicking a shaded area, after plotting it on the graph, will show you the total area of the shaded region. The Supply and Demand for Computer Keyboards Demand Equilibrium A Consumer Surplus ◇ Producer Surplus PRICE (Dollars per keyboard) 300 270 240 210 160 150 120 90 60 30 0 Supply 0 10 20 30 60 50 40 60 70 QUANTITY (Keyboards) Total net benefit (or total surplus) in this market is s 90 100

Microeconomics: Principles & Policy
14th Edition
ISBN:9781337794992
Author:William J. Baumol, Alan S. Blinder, John L. Solow
Publisher:William J. Baumol, Alan S. Blinder, John L. Solow
Chapter4: Supply And Demand: An Initial Look
Section: Chapter Questions
Problem 4DQ

Related questions
Question
Solve it correctly
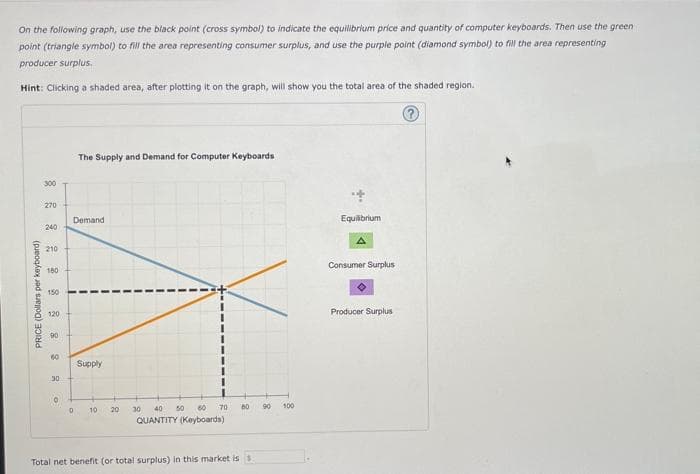
Transcribed Image Text:On the following graph, use the black point (cross symbol) to indicate the equilibrium price and quantity of computer keyboards. Then use the green
point (triangle symbol) to fill the area representing consumer surplus, and use the purple point (diamond symbol) to fill the area representing
producer surplus.
Hint: Clicking a shaded area, after plotting it on the graph, will show you the total area of the shaded region.
The Supply and Demand for Computer Keyboards
Demand
Equilibrium
Consumer Surplus
Producer Surplus
PRICE (Dollars per keyboard)
8 8 8 8 # % % %
300
270
240
210
180
150
120
Supply
10
20
70
0
ВО
90
30 40 50 60
QUANTITY (Keyboards)
Total net benefit (or total surplus) in this market is s
30
0
100
Expert Solution
This question has been solved!
Explore an expertly crafted, step-by-step solution for a thorough understanding of key concepts.

This is a popular solution!

Trending now
This is a popular solution!

Step by step
Solved in 2 steps with 1 images

Knowledge Booster


Learn more about
Need a deep-dive on the concept behind this application? Look no further. Learn more about this topic, economics and related others by exploring similar questions and additional content below.Recommended textbooks for you
Microeconomics: Principles & Policy
Economics
ISBN:
9781337794992
Author:
William J. Baumol, Alan S. Blinder, John L. Solow
Publisher:
Cengage Learning

Exploring Economics
Economics
ISBN:
9781544336329
Author:
Robert L. Sexton
Publisher:
SAGE Publications, Inc

Microeconomics: Principles & Policy
Economics
ISBN:
9781337794992
Author:
William J. Baumol, Alan S. Blinder, John L. Solow
Publisher:
Cengage Learning
Exploring Economics
Economics
ISBN:
9781544336329
Author:
Robert L. Sexton
Publisher:
SAGE Publications, Inc


Economics (MindTap Course List)
Economics
ISBN:
9781337617383
Author:
Roger A. Arnold
Publisher:
Cengage Learning