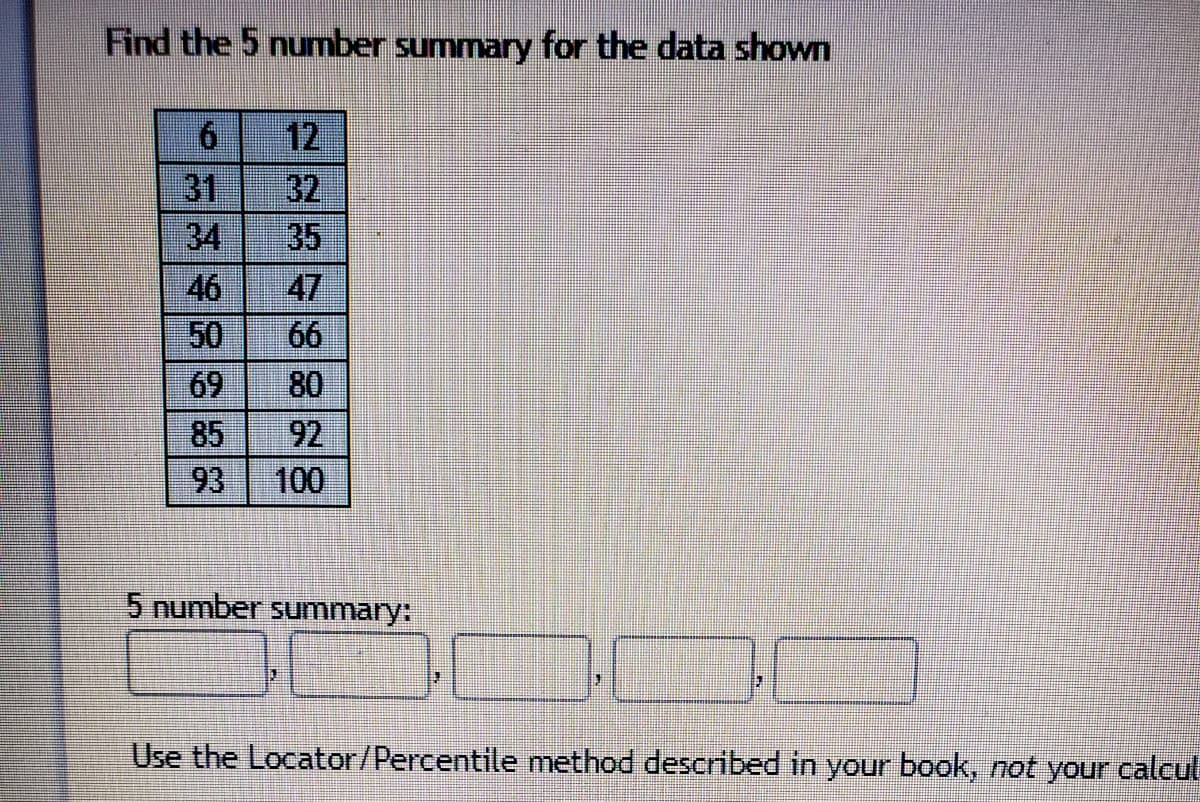
Find the 5 number summary for the data shown 12 31 32 34 35 46 47 50 66 69 80 85 92 93 100 5 number summary:


Q: Find the 5 number summary for the data shown below. 80 74 56 52 81 69 45 5 60 4 5 number…
A: Given data set in ascending order is 4,5,45,52,56,60,69,74,80,81. The minimum observation is 4. The…
Q: Find the 5 number summary for the data shown below. 97 65 62 83 85 7 3 15 94 87 5 number…
A: Writing the numbers is ascending order(from smallest to largest) 3, 7, 15, 62, 65, 83, 85, 87, 94,…
Q: Find the range for this list of numbers 39 46 29 94 54 27 95 11 51 89 100 56 75 9, 5
A: Sort the data in the ascending order 5 9 11 27 29 39 46 51 54 56 75 89 94 95 100 Minimum value…
Q: 36 45 49 53 55 56 59 61 62 65 67 72 77 80 81 85 91 94 96 98
A:
Q: For the 20 test scores shown, find the percentile rank for a score of 88. 72 63 92 74 86 50 77 82 98…
A:
Q: Find the Missing figure in the following data : Year 1950 1955 1960 1965 1970 Sales of Cloth 250 285…
A: Introduction We have to find out the missing data in the given table. This question is related to…
Q: Given: Test scores are 59 95 82 78 66 82 65 78 66 66 79 82 66 82. Find the PERCENTILE for the test…
A: We have to percentile for 79 ..
Q: Based on the data shown y = 4. 14.48 16.8 6. 18.52 21.04 20.46 9 23.68 10 26.1 11 24.72 12 27.44 13…
A: From given data, X Y X*Y X*X 4 14.48 57.92 16 5 16.8 84 25 6 18.52 111.12 36 7 21.04…
Q: Find the following for this data on average temperature and rainfall for eight months in Boston,…
A: Hello! As you have posted more than 3 sub parts, we are answering the first 3 sub-parts. In case…
Q: find mean of the data 52 54 75 45 12 27 16
A:
Q: The following data were collected on the height (inches) and weight (pounds) of women swimmers.…
A: Regression equation is
Q: Find the median of the data. 70 75 70 84 90 92 84 85 80 60 72 78 80 81 72 79 78 76 86 O 74.7 O 78.5…
A: We know that n= 20 , even Median =( n/2th + (n/2 + 1)th ) / 2
Q: Find the 5 number summary for the data shown 28 30 64 45 69 70 80 83 91 92 5 number summary(from…
A: Obtain the five number summary. The five number summary is obtained below: Boxplot: The box…
Q: A student wanted to study how many matches came in a box. They recorded the following data. How many…
A:
Q: Find the 5 number summary for the data shown 9 21 27 28 38 50 54 58 66 92 93
A:
Q: Find the 5 number summary and IQR for the data shown below (data sorted across the rows). 4 12 15 22…
A: Given data is,4 , 12 , 15 , 22 , 25 , 33 , 47 , 53 , 65 , 66The given data is already arranged in…
Q: The table data: 15 1.75 13 1.63 11 1.5 9 1.35 7 1.19 5 1.01 3 0.78
A: As per our guidelines, we are allowed to answer three sub-parts. Thanks The following data are…
Q: Find the 5 number summary for the data shown 14 24 25 41 45 48 62 68 76 83 88 92 93 5 number…
A: Obtain the values of five number summary. The values of five number summary is obtained below as…
Q: The ages (in years) of 21 people are listed below: 15 18 18 19 22 23 24 24 24 24 25 26 26 27 28 28…
A: An outlier is any data point more than 1.5 interquartile range as below the first quartile or above…
Q: Find the mean for this list of numbers 14 57 47 92 82 89 68 59 17 62 49 4 90 26 Mean= Submit…
A:
Q: Find the point estimate for the population mean. a. 75.4 b. 81.3 c. 72.8 d. 76.8
A: We know that : The sample mean (̄x) is a point estimate of the population mean, μ
Q: Find the 5 number summary for the data shown 2 12 19 23 38 40 57 68 90 99 5 number summary:
A:
Q: Find the 5 number summary for the data shown 6 8 11 17 29 31 45 51 56 67 75 88 89 5 number summary:
A: to find five-number summarystep1: put your numbers in ascending order (from smallest to largest)6 ,…
Q: Extrapolate the business done in 2018 from the following data : Year : 2013 2014 2015 2016 2017…
A:
Q: Make a stemplot for the following data and explain your observations: 13 66 36 12 8 27 7 7 52 48 15…
A: Stem and leaf plot is a graph which split into two parts as stem and leaf. Where stem is usually…
Q: Find the IQR for the following data values: 375, 210, 150, 147, 429, 389, 580, 507, 180. 303 O a. O…
A: Arranging the data values in ascending order: 147, 150, 180, 210, 375, 389, 429, 507, 580 Number of…
Q: Find the 5 number summary for the data shown 11 12 15 22 28 54 57 64 66 68 74 76 87 88 96 5…
A:
Q: Find the 5 number summary for the data shown 13 14 28 31 34 40 68 73 84 100 5 number summary:
A: Solution
Q: Find the 5 number summary for the data shown below. 60 16 76 45 6 34 79 64 22 69
A: Find the 5 number summary for the data shown below. 60 16 76 45 6 34 79 64 22 69
Q: Find the 5 number summary for the data shown 3. 10 18 33 34 41 51 58 85 89
A: Given information: Minimum value is 3. The maximum value is 89.
Q: Find the 5 number summary for the data shown. 1 11 25 29 45 50 60 70 73 84 94 97 100 5 number…
A:
Q: Calculate ¯xx¯ (x-bar) for the data shown, to two decimal places
A: It is given that, We have the value of data X as 8.3,8.7,5,5.5,26.6 We know that x̅(X-bar) is…
Q: The test scores of 19 students are listed below. Find the 7th decile. * 36 45 49 53 55 56 59 61 62…
A:
Q: 96 98 72 55 78 84 87 92 73 47 32 66 78 94 86 89 90 33 67 92 87 ie above data qualitative data or…
A:
Q: Complete the table. Ages Number of students Cumulative Frequency 15-18 4 19-22 4 23-26…
A: Cumulative frequency : Cumulative frequency is found by adding up all successive frequencies in a…
Q: Complete parts (a) through (h) for the data below 30 40 50 60 70 y 80 77 73 66 52
A: Scatter diagram are useful to visually examine the slope, direction of data set.
Q: Find the 5 number summary for the data shown 11 12 27 43 70 73 74 79 81 85 90 91 5 number…
A: Sort the data in ascending order. The Second quartile (Q2) or median is the center of value.…
Q: What is the five number summary for this data: 61 74 47 60 62 63 65 79 55 85? How do I get to the…
A: The given data can be sorted in ascending order as follows: 47, 55, 60, 61, 62, 63, 65, 74, 79, 85.…
Q: Use 5-point bins (95 to 99, 90 to 94, etc.) to make a frequency table for the set of exam scores…
A: Given data is 71,73,98,83,86,99,83,96,87,71,86,76,78,70,99,92,78,95,73,82sample size(n)=20
Q: Find the percentile for the data value. Data set: 20 20 70 40 20 50 90 90 110 30 20 90 60 10 90;…
A: Arrange the data in order. 10, 20, 20, 20, 20, 30, 40, 50, 60, 70, 90, 90, 90, 90, 110.
Q: Find the 5 number summary for the data shown 4. 31 50 53 61 64 70 72 81 85 87 5 number summary:
A:
Q: Find the 5-number summary for the data shown 23 51 52 56 60 67 76 89 92 94 5 number summary:…
A:
Q: Find the 5 number summary for the data shown. 2 3 5 9 26 | 43 46 68 72 86 87 92 95 5 number summary:
A: Solution-: We find the five number summary for data: 2,3,5,9,26,43,46,68,72,86,87,92,95
Q: Find the 5 number summary for the data shown 3 34 38 41 43 66 70 71 81 83 100 5 number…
A: Introduction: The five-number summary includes the minimum, first quartile, second quartile…
Q: Find the 5 number summary for the data shown. 1 6 13 16 23 19 51 29 54 67 76 80 91 5 number summary:
A: Given that Data values : 1 , 6 , 13 , 16 , 19 , 23 , 29 , 51 , 54 , 67 , 76 , 80 , 91 Number of…
Q: Find the 5 number summary for the data shown
A: Here, there are 12 data observations. Therefore, n = 12. In the given data set, the minimum value is…
Q: Find the 5 number summary for the data shown 6 17 21 24 30 41 44 62 78 84 92 93 5 number…
A: Five-number summary is one of the method used for data summarization . It gives the rough idea about…
Q: 25 35 72 71 88 94 77 74 43 56 56 74 55 62 77 49 86 42 66 97 58 45 73 45 83 85 47
A: Given data:…
Q: low shows the number of people visiting a lo les. 35 37 23 18 12 23 21 18 22 19 15 26 19 20 29 33 18…
A: Solution: Let X be the number of people. The data for X is 5, 12, 19, 29, 35, 23, 15, 33, 37, 21,…

Step by step
Solved in 2 steps with 13 images
