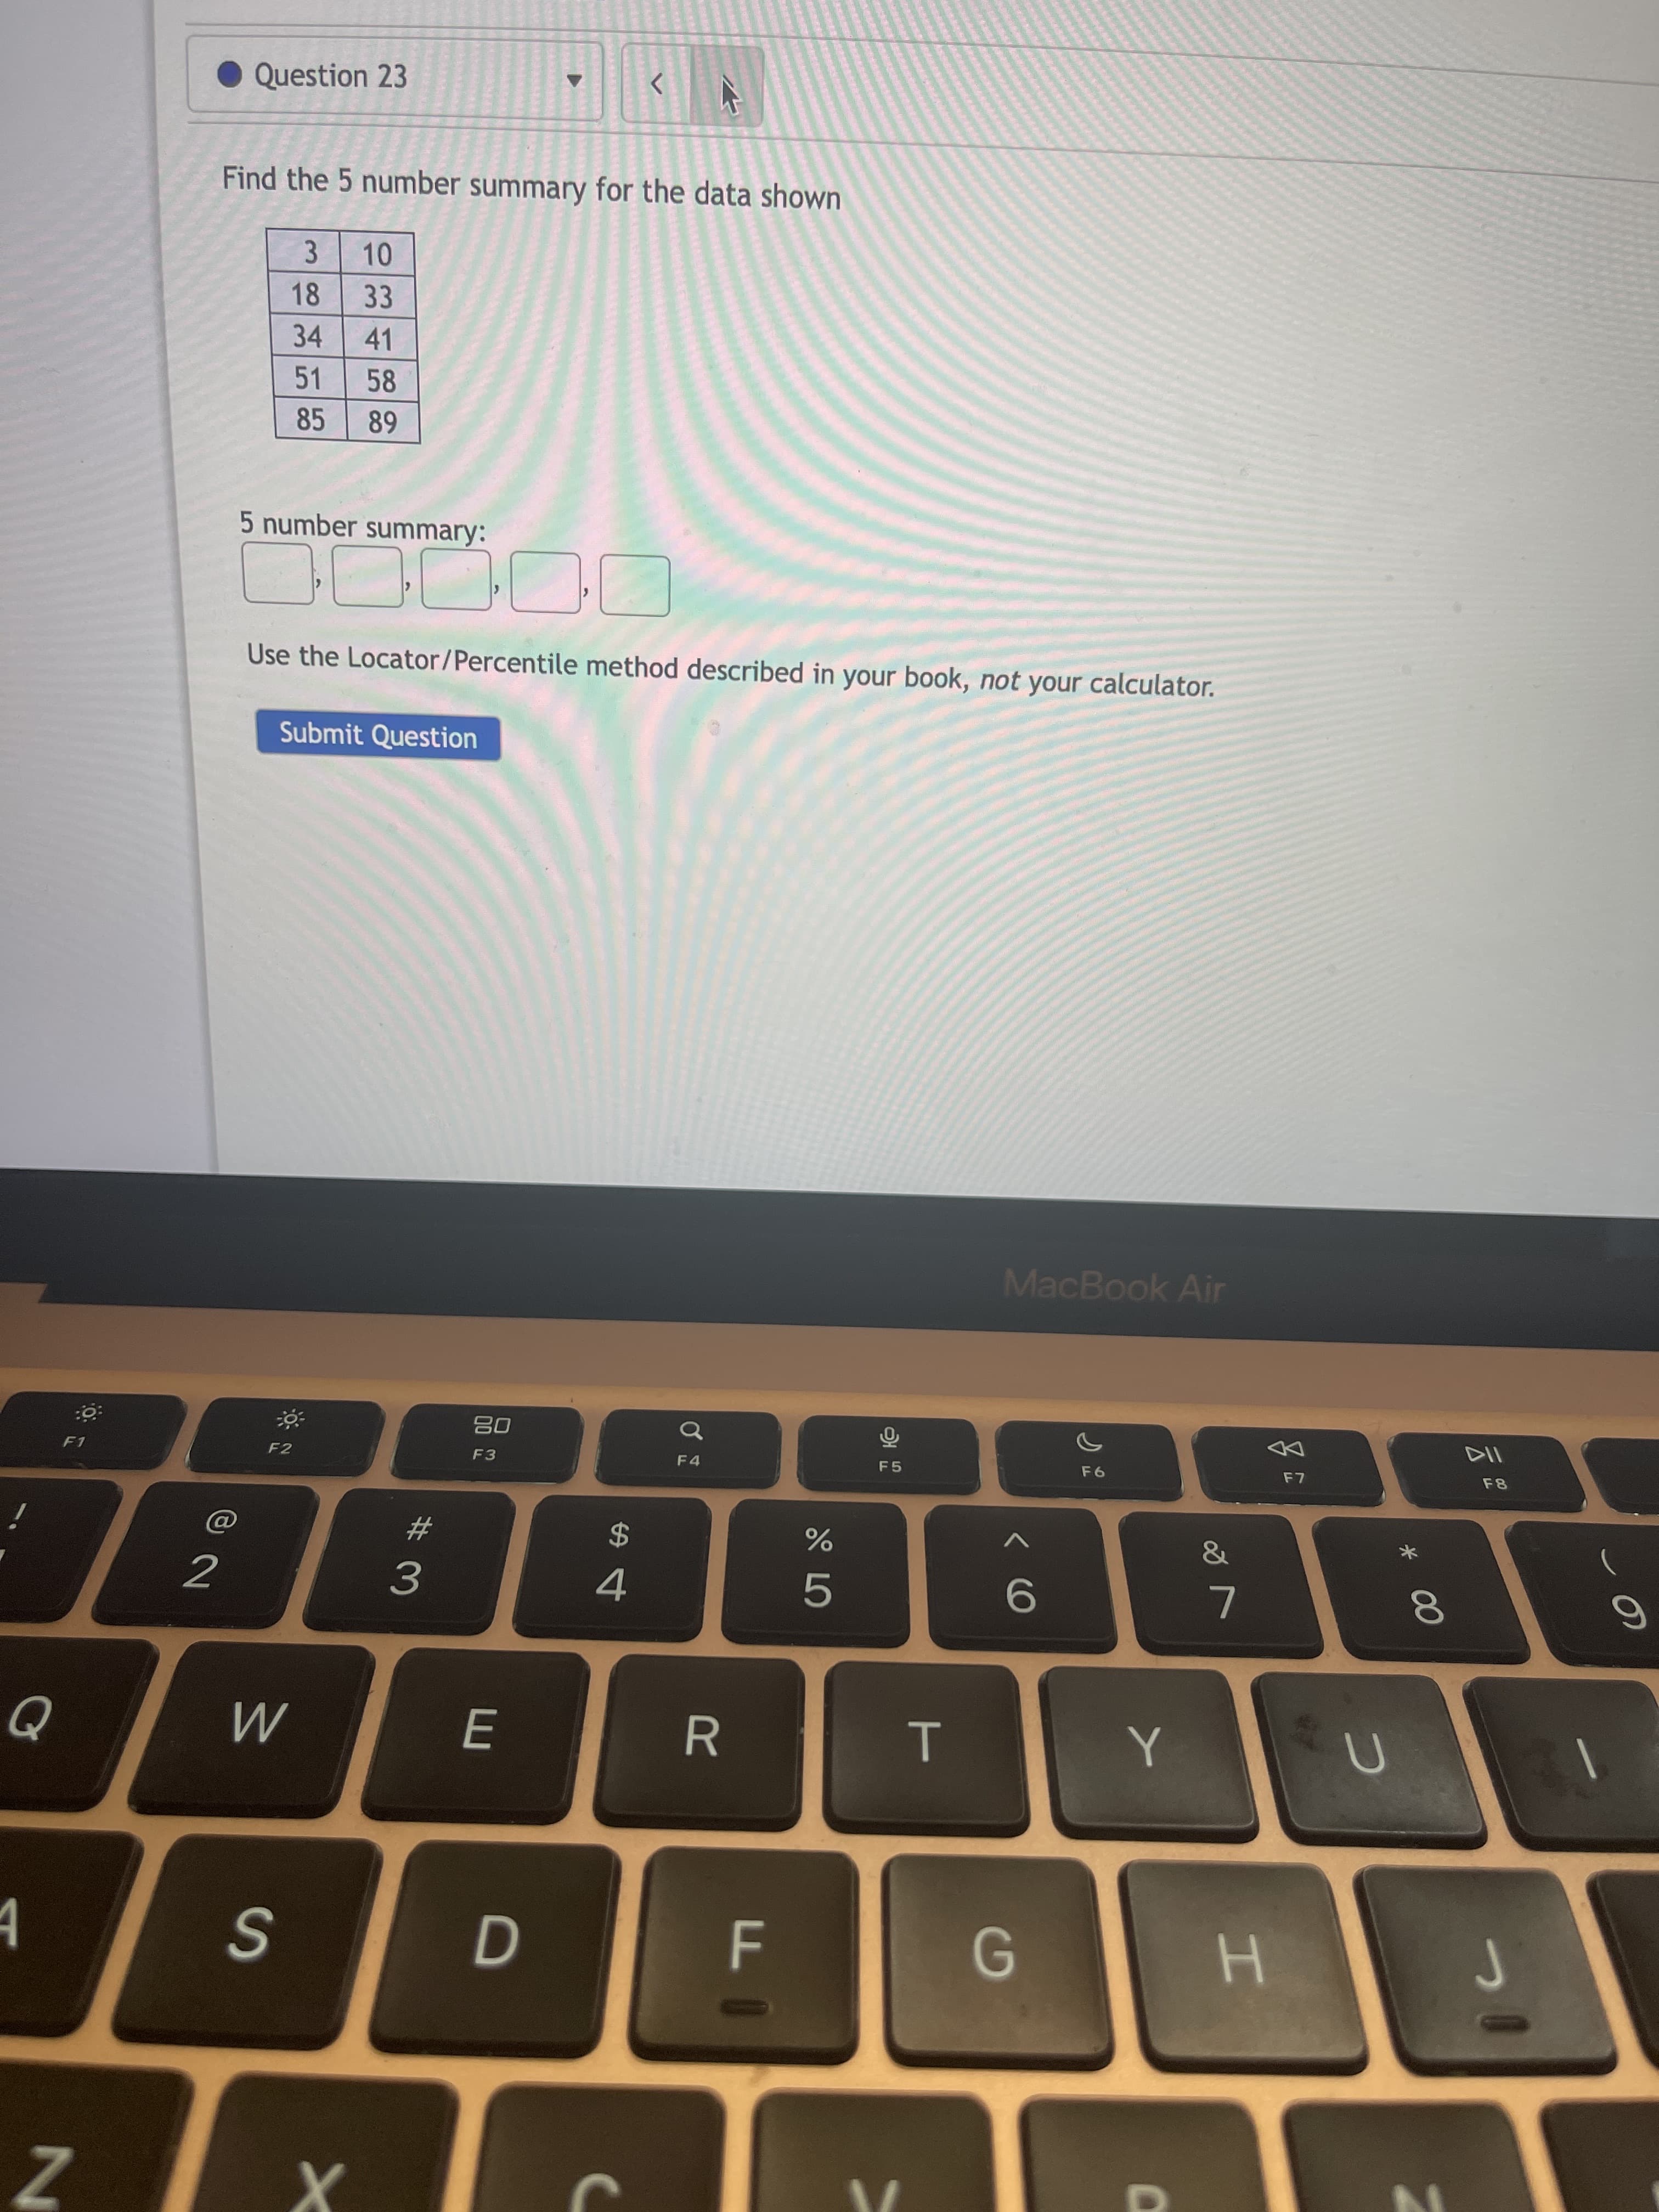
Find the 5 number summary for the data shown 3. 10 18 33 34 41 51 58 85 89


Q: Find the Mean number of the percents 4.38+4.62+4.88+5.02+5.33+6.30
A: Mean is the measure of central tendency. mean of the observations is sum of observations divided by…
Q: Find the 5 number summary for the data shown 12 31 32 34 35 46 47 50 66 69 80 85 92 93 100 5 number…
A: Solution-: We find five number summary for given data
Q: Find the Missing figure in the following data : Year 1950 1955 1960 1965 1970 Sales of Cloth 250 285…
A: Introduction We have to find out the missing data in the given table. This question is related to…
Q: 1. Complete the table Po P - value а. 100 40/100 8% b. 248 51/248 10% C. 312 100/312 12% d. 486…
A: See the handwritten solution
Q: A grocery store manager did a study to look at the relationship between the amount of time (in…
A: Time Money 5 23 19 92 27 87 10 27 20 69 10 58 30 124
Q: b) Construct divided difference table for the following data: (chop to 3-digits) 3 5 13 f(x) 34 46…
A:
Q: find out he 78th percntile for given data 45,78,85,89,3,5,69,63,78
A:
Q: For the data set below, find the IQR. 64 74 74 68 70 73 61 70 59 76 77 Send data to Excel
A: Interquartile Range(IQR), is the difference between the middle term of lower half of the data on the…
Q: find q1 for given data 58,96,98,78,56,47,25,37,85
A:
Q: Find the 5 number summary for the data shown 28 30 64 45 69 70 80 83 91 92 5 number summary(from…
A: Obtain the five number summary. The five number summary is obtained below: Boxplot: The box…
Q: Find the IQR for the following data values: 375, 210, 150, 147, 429, 389, 580, 507, 180.
A:
Q: Find the 5 number summary and IQR for the data shown below (data sorted across the rows). 4 12 15 22…
A: Given data is,4 , 12 , 15 , 22 , 25 , 33 , 47 , 53 , 65 , 66The given data is already arranged in…
Q: find D3 for given data 15,46,96,87,7535,14,49,38
A:
Q: Find the 5 number summary for the data shown 14 24 25 41 45 48 62 68 76 83 88 92 93 5 number…
A: Obtain the values of five number summary. The values of five number summary is obtained below as…
Q: Find the 5 number summary for the data shown 6 8 11 17 29 31 45 51 56 67 75 88 89 5 number summary:
A: to find five-number summarystep1: put your numbers in ascending order (from smallest to largest)6 ,…
Q: Calculate the average job gains using the numbers you obtain, 36,239.
A: The given numbers of jobs are 36 and 239.
Q: Complete the data table
A: Given table is, Cr standard (ppm) Absorbance 1 Absorbance 2 Absorbance 3 Mean±SD 1…
Q: The annual amount of rainfall for 25 cities was recorded and is shown in the histogram below. Annual…
A: Given, The annual amount of rainfall for 25 cities are recorded and shown in the histogram as…
Q: Find the mode of the data set: 234, 228, 234, 229, 234, 278 О 229 О 231.5 О 234 О 239.5
A:
Q: Plot the data below using the stem and leaf method. a) 320,332,339,343,345,348,351,352,364,376
A: We need to plot the given data using stem and leaf method The solution to the given question is…
Q: What is the average of the following numbers? 2, 5, 8, 1 3 4 4.5
A:
Q: Estimate the average by first rounding to the nearest 1,000: 1,000 2,300 2,600 a) 2000 b) 3000…
A:
Q: Rob counted the number of words per page in his new book. Use the data to complete the frequency…
A: Introduction: The number of pages with number of words in the range 20-29 can be obtained by…
Q: Calculate the 60th percentlle of the data shown 2.7 7.3 9.6 10.1 12.1 21
A: Given that, The number of observations is given. Percentile is given by,
Q: The scores of the top ten finishers in a recent Buick Open are listed below. Find the median score.…
A: We have given that, The data set are : 65, 66, 67, 66, 67, 70, 67, 70, 71, 68 Then, We will find…
Q: Find the 5 number summary for the data shown. 1 11 25 29 45 50 60 70 73 84 94 97 100 5 number…
A:
Q: 18. Extrapolate the business done in 2018 from the following data : 2014 Year 2013 2015 2016 2017…
A:
Q: Given data: 147, 243, 156, 632, 543, 303, 559 Find the five-number summary.
A: The five-number summary includes: Minimum value First quartile Median Third quartile Maximum value
Q: Find the D, for the following data 11, 25, 20, 15, 24, 28, 19, 21
A: We have given that, The data set is, 11, 25, 20, 15, 24, 28, 19, 21 Then, We will find the 6th…
Q: Below are the ages of ten women who have been recognized for their social work:…
A:
Q: 3- Find the range of the following data. (i) 63, 89, 98, 125, 79, 108, 117, 68
A: (3) (i) The given data set is, 63, 89, 98, 125, 79, 108, 117, 68 The formula for calculating the…
Q: Find the 5 number summary for the data shown 11 12 27 43 70 73 74 79 81 85 90 91 5 number…
A: Sort the data in ascending order. The Second quartile (Q2) or median is the center of value.…
Q: The scores of the top ten finishers in a recent race are listed below. 65 66 66 67 67 67 68 70 70 71…
A: we have to find the median score
Q: Find the median of the set of numbers 11 25 18 79 12 13
A: Given data is,11,25,18,79,12,13
Q: Find the 5 number summary for the data shown 4. 31 50 53 61 64 70 72 81 85 87 5 number summary:
A:
Q: Find the 5-number summary for the data shown 23 51 52 56 60 67 76 89 92 94 5 number summary:…
A:
Q: For the data shown, answer the questions. Round to 2 decimal places. 10.4 12 2.9 21.4 5.3 22.8 2.6
A: Given data, 10.4,12,2.9,21.4,5.3,22.8,2.6 Sort the data in ascending order.…
Q: Find the 5 number summary for the data shown. 2 3 5 9 26 | 43 46 68 72 86 87 92 95 5 number summary:
A: Solution-: We find the five number summary for data: 2,3,5,9,26,43,46,68,72,86,87,92,95
Q: mary is 000 and 1001 ler. Type integers or decimals. Do r w represents the data?
A: The 14 systolic readings are given below. 148 125 135 120 120 125 148 130 125 141 122 140 150 150…
Q: Find the 25th, 50th, and 75th percen 15 24 31 35 38 42 48 49 54 57 60 62 72 73 74 76 78 80 89 92 93…
A:
Q: Find the 5 number summary for the data shown. 1 6 13 16 23 19 51 29 54 67 76 80 91 5 number summary:
A: Given that Data values : 1 , 6 , 13 , 16 , 19 , 23 , 29 , 51 , 54 , 67 , 76 , 80 , 91 Number of…
Q: Find the 5 number summary for the data shown
A: Here, there are 12 data observations. Therefore, n = 12. In the given data set, the minimum value is…
Q: Find the 5 number summary for the data shown 6 17 21 24 30 41 44 62 78 84 92 93 5 number…
A: Five-number summary is one of the method used for data summarization . It gives the rough idea about…
Q: he median of the set of values. Round to 53 31 22 86 79 90 19 97 24 11 11
A: Given : Median : Median is the middle value of the sorted data.
Q: Calculate 2 (x-bar) for the data shown, to two decimal places 28.1 6.2 24.5 11.5 8.7 6.7 169 3.2
A: Measure of central tendency measures the central or average value of a dataset. There are different…
Q: find D7 for given data 12,15,96,85,35,74,63,59,42,39,28,19,35
A:
Q: low shows the number of people visiting a lo les. 35 37 23 18 12 23 21 18 22 19 15 26 19 20 29 33 18…
A: Solution: Let X be the number of people. The data for X is 5, 12, 19, 29, 35, 23, 15, 33, 37, 21,…
Q: Find the median for this list of numbers
A: Median is a measure of central tendency of a data set. The middle value of the data set is called…
Q: Find the 5 number summary for the data shown 11 13 17 23 34 49 69 82 97 98 5 number summary:
A:

Step by step
Solved in 2 steps

- Given a set of data where mean = 37, SD = 6.2. Show your worka. Calculate the z score for 31b. Calculate the percentile score for 31c. What percentage of the population would be expected to have a score greater than 41Below is bivariate data on vintage dresser auctions, where X is the year of construction of the dresser and Y is the price sold at auction. Answer the following questions below using evidence.The following data were collected from a Repeated-Measures study. Perform an ANOVA. Use Instructions: Use the data collected to compute the values listed in Table#1. data @.05 person Trial 1 Trial 2 Trial 3 A 0 0 6 B 1 3 6 C 0 1 6 D 4 5 8 E 0 1 4 Table #1 1. SS between subjects 2. Df between subjects 3. Df between 4. Df within 5. SS total 6. SS error 7. Df error 8. F (critical) as reported on F ratio table 9. F ratio (computed) 10. MS error 11. HSD 12. APA summary
- Is there a difference in the amount of airborne bacteria between carpeted and uncarpeted rooms? In an experiment, seven rooms were carpeted and seven were left uncarpeted. The rooms were similar in size and function. After a suitable period, the concentration of bacteria in the air was measured (in units of bacteria per cubic foot) in all of these rooms. The data and summaries are provided: x¯ s Carpeted rooms 184 22.0 Uncarpeted rooms 170 16.9 A 95% confidence interval for the difference in mean bacterial concentration in the air of carpeted rooms versus uncarpeted rooms (using the conservative value for the degrees of freedom) is: Select one: −11.7 to 39.7. −16.66 to 34.66. −7.47 to 31.47. −18.89 to 42.89.A study assessed the lung destructive index among smokers and non- smokers provided the following data Smokers : overline x 1 =14.5 n 1 =12 S P =2.50 Non- Smokers: overline x 2 =9.5 n 2 =10 a = .05 From the available data, can we conclude that smokers have greater lung damage than non-smokers?A researcher is interested in hamster wheel-running activity during the summer versus the winter. She suspects that either the hamsters will run less during the winter to conserve energy or they will run more to keep warm. She records the activity of n = 25 hamsters during June, July, and August and compares their running-wheel revolutions per hour to the activity of the same hamsters during December, January, and February.The data are collected, and the results show an average difference score of MD = 5.4 and a sum of squares of SS = 1,142.64. What is the value for degrees of freedom for this repeated-measures t test? a) 25 b) 37 c) 24 d) 34 What is the sample standard deviation (s) for the D scores? a) 1.38 b) 1,142.64 c) 6.9 d) 47.61 What is the estimated standard error of the mean difference (sMD) for this study? a) 1.38 b) 1.17 c) 1.90 d) 0.28
- A repeated-measures and an independent-measures study both produce a t statistic with df=20. How many subjects participated in each experiment?using monthly data from January 1992 to December 2000, we estimate the following equation for lightweight vehicle sales: Δln (Salest) = 2.7108 + 0.3987Δln (Salest −1) + εt. table 5 gives sample autocorrelations of the errors from this model. table 5 lag 1 2 3 4 5 6 7 8 9 10 11 12 Different Order autocorrelations of Differences in the logs of vehicle Sales autocorrelation 0.9358 0.8565 0.8083 0.7723 0.7476 0.7326 0.6941 0.6353 0.5867 0.5378 0.4745 0.4217 Standard error 0.0962 0.0962 0.0962 0.0962 0.0962 0.0962 0.0962 0.0962 0.0962 0.0962 0.0962 0.0962 t-Statistic 9.7247 8.9005 8.4001 8.0257 7.7696 7.6137 7.2138 6.6025 6.0968 5.5892 4.9315 4.3827 a. use the information in the table to assess the appropriateness of the specification given by the equation. b. if the residuals from the ar(1) model above violate a regression assumption, how would you modify the ar(1) specification?For a certain experiment, the following values of fracture stress (in megapascals) presented below were measured for a sample of 24 mixtures of hot-mixed asphalt (HMA). Determine the median, the lower quartile, the upper quartile, and the 65th percentile of the measurements.
- Data for gas mileage (in mpg) for different vehicles was entered into a software package and part of the ANOVA table is shown below: Source DF SS MS Vehicle 2 440 220.00 Error 17 318 18.71 Total 19 758 Determine the p-value for the data. a) 0.0052 b) 0.8994 c) 0.0006 d) 0.0021 e) 0.0236 f) None of the aboveA researcher is interested in hamster wheel-running activity during the summer versus the winter. She suspects that either the hamsters will run less during the winter to conserve energy or they will run more to keep warm. She records the activity of n = 25 hamsters during June, July, and August and compares their running-wheel revolutions per hour to the activity of the same hamsters during December, January, and February. The data are collected, and the results show an average difference score of MD = 5. 7 and a sum of squares of SS = 2,851.44. What is the estimated standard error of the mean difference (SMD) for this study? (two decimals)A researcher is interested in hamster wheel-running activity during the summer versus the winter. She suspects that either the hamsters will run less during the winter to conserve energy or they will run more to keep warm. She records the activity of n = 25 hamsters during June, July, and August and compares their running-wheel revolutions per hour to the activity of the same hamsters during December, January, and February. The data are collected, and the results show an average difference score of MD = 5. 7 and a sum of squares of SS = 2,851.44. What is the sample standard deviation (s) for the D scores? (one decimal)