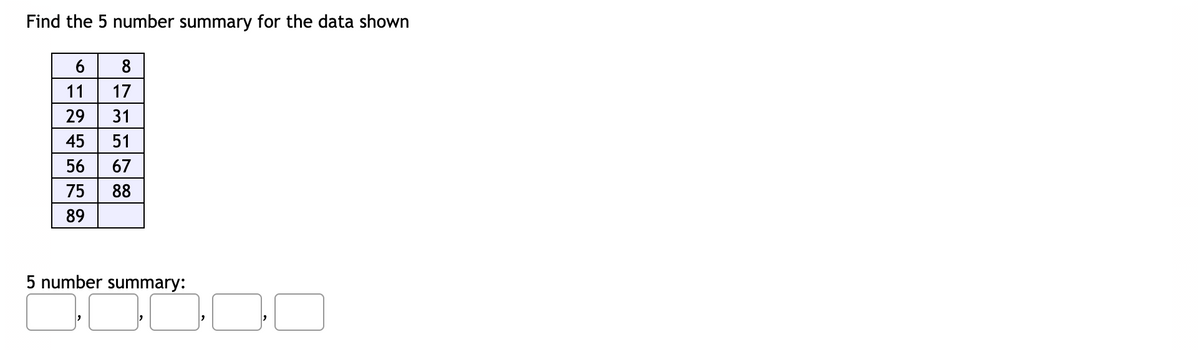
Find the 5 number summary for the data shown 6 8 11 17 29 31 45 51 56 67 75 88 89 5 number summary:


Q: Find the 5 number summary for the data shown below. 80 74 56 52 81 69 45 5 60 4 5 number…
A: Given data set in ascending order is 4,5,45,52,56,60,69,74,80,81. The minimum observation is 4. The…
Q: Construct a boxplot for the data set below. 95 95 95 97 90 89 90 85 91 84 89 91 92 89 89 89 88 89 91…
A: We have given that, The data set is, 95, 95, 95, 97, 90, 89, 90, 85, 91, 84, 89, 91, 92, 89, 89,…
Q: For the 20 test scores shown, find the percentile rank for a score of 88. 72 63 92 74 86 50 77 82 98…
A:
Q: Find the 5 number summary for the data shown 12 31 32 34 35 46 47 50 66 69 80 85 92 93 100 5 number…
A: Solution-: We find five number summary for given data
Q: 9 10 11 12 13 14 15 16 17 18 19 20 data 8 Based on the boxplot above, identify the 5 number summary
A: The 5-number summary is defined as, the minimum value, the lower quartile, the median, the upper…
Q: Q1 for data set: 41, 49, 55, 82, 84, 85, 93, 103, 113, 121, 126, 127, 136, 136, 155, 166, 169,…
A: The first or lower quartile (Q1) is a value below which 25% of the observations lies and above which…
Q: The following data were collected on the height (inches) and weight (pounds) of women swimmers.…
A: Regression equation is
Q: Find the 5 number summary for the data shown 28 30 64 45 69 70 80 83 91 92 5 number summary(from…
A: Obtain the five number summary. The five number summary is obtained below: Boxplot: The box…
Q: Use the data to make a frequency table. 1. number of students per class: 26 18 25 28 24
A: According to the scenario, the lowest number is 15 and highest number is 30. Thus the range is =…
Q: Find the 5 number summary for the data shown using technology 3 6 11 14 31 38 39 57 68 89 90 95…
A:
Q: Find the 5 number summary for the data shown 9 21 27 28 38 50 54 58 66 92 93
A:
Q: Find the 5 number summary and IQR for the data shown below (data sorted across the rows). 4 12 15 22…
A: Given data is,4 , 12 , 15 , 22 , 25 , 33 , 47 , 53 , 65 , 66The given data is already arranged in…
Q: The table data: 15 1.75 13 1.63 11 1.5 9 1.35 7 1.19 5 1.01 3 0.78
A: As per our guidelines, we are allowed to answer three sub-parts. Thanks The following data are…
Q: Find the 5 number summary for the data shown 14 24 25 41 45 48 62 68 76 83 88 92 93 5 number…
A: Obtain the values of five number summary. The values of five number summary is obtained below as…
Q: The ages (in years) of 21 people are listed below: 15 18 18 19 22 23 24 24 24 24 25 26 26 27 28 28…
A: An outlier is any data point more than 1.5 interquartile range as below the first quartile or above…
Q: Find the mean for this list of numbers 14 57 47 92 82 89 68 59 17 62 49 4 90 26 Mean= Submit…
A:
Q: Find the point estimate for the population mean. a. 75.4 b. 81.3 c. 72.8 d. 76.8
A: We know that : The sample mean (̄x) is a point estimate of the population mean, μ
Q: Make a stemplot for the following data and explain your observations: 13 66 36 12 8 27 7 7 52 48 15…
A: Stem and leaf plot is a graph which split into two parts as stem and leaf. Where stem is usually…
Q: Find the IQR for the following data values: 375, 210, 150, 147, 429, 389, 580, 507, 180. 303 O a. O…
A: Arranging the data values in ascending order: 147, 150, 180, 210, 375, 389, 429, 507, 580 Number of…
Q: For the data set, {8, 3, 1, 11, 8, 7}, Q1 3.0 %3D Q3 8.0 ニ IQR = | 8.25
A:
Q: Construct a boxplot for the data
A: arrange the data in ascending order data in ascending order is: 41.0, 45.0, 46.0, 53.0, 57.0,…
Q: Find the range for the set of data given. 70 142 38 101 190
A: Here the given data is 70, 142, 38, 101, 190 The range of data is R=gratest number- lowetst number…
Q: State the Five Number Summary for the following dataset. 44 45 46 47 49 51 54 55 58…
A:
Q: Find the mode of the data set: 234, 228, 234, 229, 234, 278 О 229 О 231.5 О 234 О 239.5
A:
Q: Find the 5 number summary for the data shown 11 12 15 22 28 54 57 64 66 68 74 76 87 88 96 5…
A:
Q: Find the 5 number summary for the data shown below. 60 16 76 45 6 34 79 64 22 69
A: Find the 5 number summary for the data shown below. 60 16 76 45 6 34 79 64 22 69
Q: Find the 5 number summary for the data shown 3. 10 18 33 34 41 51 58 85 89
A: Given information: Minimum value is 3. The maximum value is 89.
Q: Calculate the 60th percentlle of the data shown 2.7 7.3 9.6 10.1 12.1 21
A: Given that, The number of observations is given. Percentile is given by,
Q: Find the 5 number summary for the data shown. 1 11 25 29 45 50 60 70 73 84 94 97 100 5 number…
A:
Q: Calculate ¯xx¯ (x-bar) for the data shown, to two decimal places
A: It is given that, We have the value of data X as 8.3,8.7,5,5.5,26.6 We know that x̅(X-bar) is…
Q: The following is data for the first and second Quiz scores for 8 students in a class.
A: Given the data for the scores of first and second score for 8 students. The excel steps to obtain…
Q: Complete the table. Ages Number of students Cumulative Frequency 15-18 4 19-22 4 23-26…
A: Cumulative frequency : Cumulative frequency is found by adding up all successive frequencies in a…
Q: Frequency 10+ 8+ 6- 4- 2 1 35 79 data 9 11 13
A: Based on the histogram given below, to determine the frequency of the class containing the value 6.…
Q: Find the midrange for the following group of data items. 112, 52, 82, 52, 72 (Round to the nearest…
A: Midrange:The midrange is defined as the average of highest and lowest value in the data set.That is,…
Q: Find the following for the data shown: 1 5 14 17 30 31 39 44 49 55 74 86 94 100 What is the…
A: We have tó find given percentile.
Q: Find the 5 number summary for the data shown 11 12 27 43 70 73 74 79 81 85 90 91 5 number…
A: Sort the data in ascending order. The Second quartile (Q2) or median is the center of value.…
Q: What is the five number summary for this data: 61 74 47 60 62 63 65 79 55 85? How do I get to the…
A: The given data can be sorted in ascending order as follows: 47, 55, 60, 61, 62, 63, 65, 74, 79, 85.…
Q: Find the 5 number summary for the data shown 4. 31 50 53 61 64 70 72 81 85 87 5 number summary:
A:
Q: Find the 5-number summary for the data shown 23 51 52 56 60 67 76 89 92 94 5 number summary:…
A:
Q: Find the 5 number summary for the data shown. 2 3 5 9 26 | 43 46 68 72 86 87 92 95 5 number summary:
A: Solution-: We find the five number summary for data: 2,3,5,9,26,43,46,68,72,86,87,92,95
Q: mary is 000 and 1001 ler. Type integers or decimals. Do r w represents the data?
A: The 14 systolic readings are given below. 148 125 135 120 120 125 148 130 125 141 122 140 150 150…
Q: Find the 5 number summary for the data shown 3 34 38 41 43 66 70 71 81 83 100 5 number…
A: Introduction: The five-number summary includes the minimum, first quartile, second quartile…
Q: Find the 5 number summary for the data shown. 1 6 13 16 23 19 51 29 54 67 76 80 91 5 number summary:
A: Given that Data values : 1 , 6 , 13 , 16 , 19 , 23 , 29 , 51 , 54 , 67 , 76 , 80 , 91 Number of…
Q: Find the first quartile for this list of numbers 44 67 87 48 13 76 19 42 22 40 65 34 8 10 88…
A: Quartile 1 : 19
Q: Find the 5 number summary for the data shown
A: Here, there are 12 data observations. Therefore, n = 12. In the given data set, the minimum value is…
Q: Find the 5 number summary for the data shown 6 17 21 24 30 41 44 62 78 84 92 93 5 number…
A: Five-number summary is one of the method used for data summarization . It gives the rough idea about…
Q: find D7 for given data 12,15,96,85,35,74,63,59,42,39,28,19,35
A:
Q: low shows the number of people visiting a lo les. 35 37 23 18 12 23 21 18 22 19 15 26 19 20 29 33 18…
A: Solution: Let X be the number of people. The data for X is 5, 12, 19, 29, 35, 23, 15, 33, 37, 21,…
Q: Find the 5 number summary for the data shown 11 13 17 23 34 49 69 82 97 98 5 number summary:
A:


Trending now
This is a popular solution!

Step by step
Solved in 2 steps


- Find the 5 number summary for the data shown 9 21 27 28 38 50 54 58 66 92 93Determine the number of significant digits in the following data of 154.65 equal to.Find P95 from the following data 1 5 8 14 21 22 23 25 26 28 30 31 34 39 40 42 43 49 53 56 59 62 64 69 72 75 77 78 79 81 83 92 94 97 100 P95 =
- Find the Q1 of the grouped data using the formula given below.The following data were collected on the height (inches) and weight (pounds) of women swimmers.Height6870646566 Weight132110106115128 b. If a swimmer’s height is 63 inches, what would you estimate her weight to be?In an insurance company study of the causes of 1,000 deaths, these data were obtained. Draw a pie chart to represent the data. Cause of Death Number of Deaths Heart disease 432 Cancer 227 Stroke 93 Accidents 24 Other 224 Total 1,000
- How many people surveyed ?Find the five-number summary for the following data set. 55, 60, 63, 74, 88, 96, 98, 106, 107, 110. The Population of a town in the last five censuses was given below. year 1940 1960 1970 1980 2000 population in million 12 15 20 27 39 Use Lagrange’s Interpolating Formula to estimate the population for the year 1950.