Find the 98% confidence interval for the difference between the means of the two populations
Find the 98% confidence interval for the difference between the means of the two populations

MATLAB: An Introduction with Applications
6th Edition
ISBN:9781119256830
Author:Amos Gilat
Publisher:Amos Gilat
Chapter1: Starting With Matlab
Section: Chapter Questions
Problem 1P

Related questions

Question
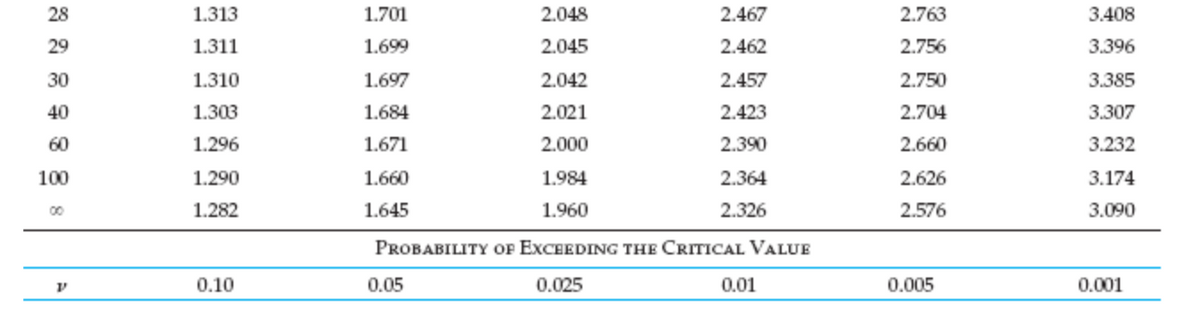
Transcribed Image Text:28
1.313
1.701
2.048
2.467
2.763
3.408
29
1.311
1.699
2.045
2.462
2.756
3.396
30
1.310
1.697
2.042
2.457
2.750
3.385
40
1.303
1.684
2.021
2.423
2.704
3.307
60
1.296
1.671
2.000
2.390
2.660
3.232
100
1.290
1.660
1.984
2.364
2.626
3.174
00
1.282
1.645
1.960
2.326
2.576
3.090
PROBABILITY OF EXCEEDING THE CRITICAL VALUE
0.10
0.05
0.025
0.01
0.005
0.001
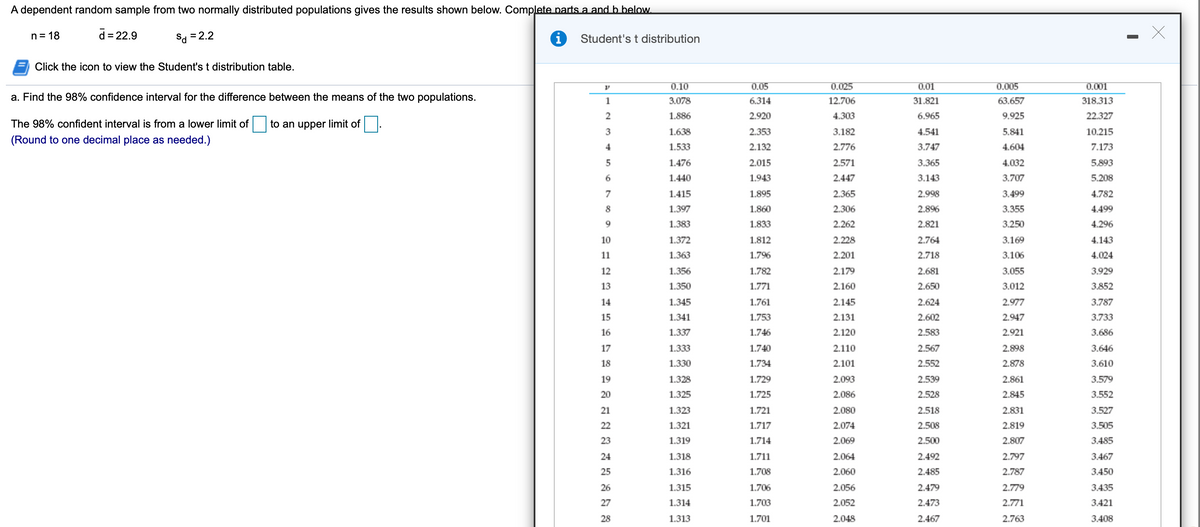
Transcribed Image Text:A dependent random sample from two normally distributed populations gives the results shown below. Complete parts a and b below.
n = 18
= 22.9
Sa = 2.2
Student's t distribution
Click the icon to view the Student's t distribution table.
0.10
0.05
0.025
0.01
0.005
0.001
a. Find the 98% confidence interval for the difference between the means of the two populations.
1
3.078
6.314
12.706
31.821
63.657
318.313
1.886
2.920
4.303
6.965
9.925
22.327
The 98% confident interval is from a lower limit of
to an upper limit of
1.638
2.353
3.182
4.541
5.841
10.215
(Round to one decimal place as needed.)
4
1.533
2.132
2.776
3.747
4.604
7.173
1.476
2.015
2.571
3.365
4.032
5.893
1.440
1.943
2.447
3.143
3.707
5.208
7
1.415
1.895
2.365
2.998
3.499
4.782
8
1.397
1.860
2.306
2.896
3.355
4.499
1.383
1.833
2.262
2.821
3.250
4.296
10
1.372
1.812
2.228
2.764
3.169
4.143
11
1.363
1.796
2.201
2.718
3.106
4.024
12
1.356
1.782
2.179
2.681
3.055
3.929
13
1.350
1.771
2.160
2.650
3.012
3.852
14
1.345
1.761
2.145
2.624
2.977
3.787
15
1.341
1.753
2.131
2.602
2.947
3.733
16
1.337
1.746
2.120
2.583
2.921
3.686
17
1.333
1.740
2.110
2.567
2.898
3.646
18
1.330
1.734
2.101
2.552
2.878
3.610
19
1.328
1.729
2.093
2.539
2.861
3.579
20
1.325
1.725
2.086
2.528
2.845
3.552
21
1.323
1.721
2.080
2.518
2.831
3.527
22
1.321
1.717
2.074
2.508
2.819
3.505
23
1.319
1.714
2.069
2.500
2.807
3.485
24
1.318
1.711
2.064
2.492
2.797
3.467
25
1.316
1.708
2.060
2.485
2.787
3.450
26
1.315
1.706
2.056
2.479
2.779
3.435
27
1.314
1.703
2.052
2.473
2.771
3.421
28
1.313
1.701
2.048
2.467
2.763
3.408
Expert Solution
This question has been solved!
Explore an expertly crafted, step-by-step solution for a thorough understanding of key concepts.

Step by step
Solved in 2 steps with 1 images

Knowledge Booster


Learn more about
Need a deep-dive on the concept behind this application? Look no further. Learn more about this topic, statistics and related others by exploring similar questions and additional content below.Recommended textbooks for you
MATLAB: An Introduction with Applications
Statistics
ISBN:
9781119256830
Author:
Amos Gilat
Publisher:
John Wiley & Sons Inc

Probability and Statistics for Engineering and th…
Statistics
ISBN:
9781305251809
Author:
Jay L. Devore
Publisher:
Cengage Learning

Statistics for The Behavioral Sciences (MindTap C…
Statistics
ISBN:
9781305504912
Author:
Frederick J Gravetter, Larry B. Wallnau
Publisher:
Cengage Learning
MATLAB: An Introduction with Applications
Statistics
ISBN:
9781119256830
Author:
Amos Gilat
Publisher:
John Wiley & Sons Inc
Probability and Statistics for Engineering and th…
Statistics
ISBN:
9781305251809
Author:
Jay L. Devore
Publisher:
Cengage Learning
Statistics for The Behavioral Sciences (MindTap C…
Statistics
ISBN:
9781305504912
Author:
Frederick J Gravetter, Larry B. Wallnau
Publisher:
Cengage Learning

Elementary Statistics: Picturing the World (7th E…
Statistics
ISBN:
9780134683416
Author:
Ron Larson, Betsy Farber
Publisher:
PEARSON

The Basic Practice of Statistics
Statistics
ISBN:
9781319042578
Author:
David S. Moore, William I. Notz, Michael A. Fligner
Publisher:
W. H. Freeman

Introduction to the Practice of Statistics
Statistics
ISBN:
9781319013387
Author:
David S. Moore, George P. McCabe, Bruce A. Craig
Publisher:
W. H. Freeman