Find the best plot for data graph and slope, and value of K for first order reaction: t (x) min 5 10 20 80 Yo 50 y 0.02 0.025 0.029 0,033 0.04 0.05
Find the best plot for data graph and slope, and value of K for first order reaction: t (x) min 5 10 20 80 Yo 50 y 0.02 0.025 0.029 0,033 0.04 0.05

Physical Chemistry
2nd Edition
ISBN:9781133958437
Author:Ball, David W. (david Warren), BAER, Tomas
Publisher:Ball, David W. (david Warren), BAER, Tomas
Chapter20: Kinetics
Section: Chapter Questions
Problem 20.28E

Related questions
Question
Ee.33.
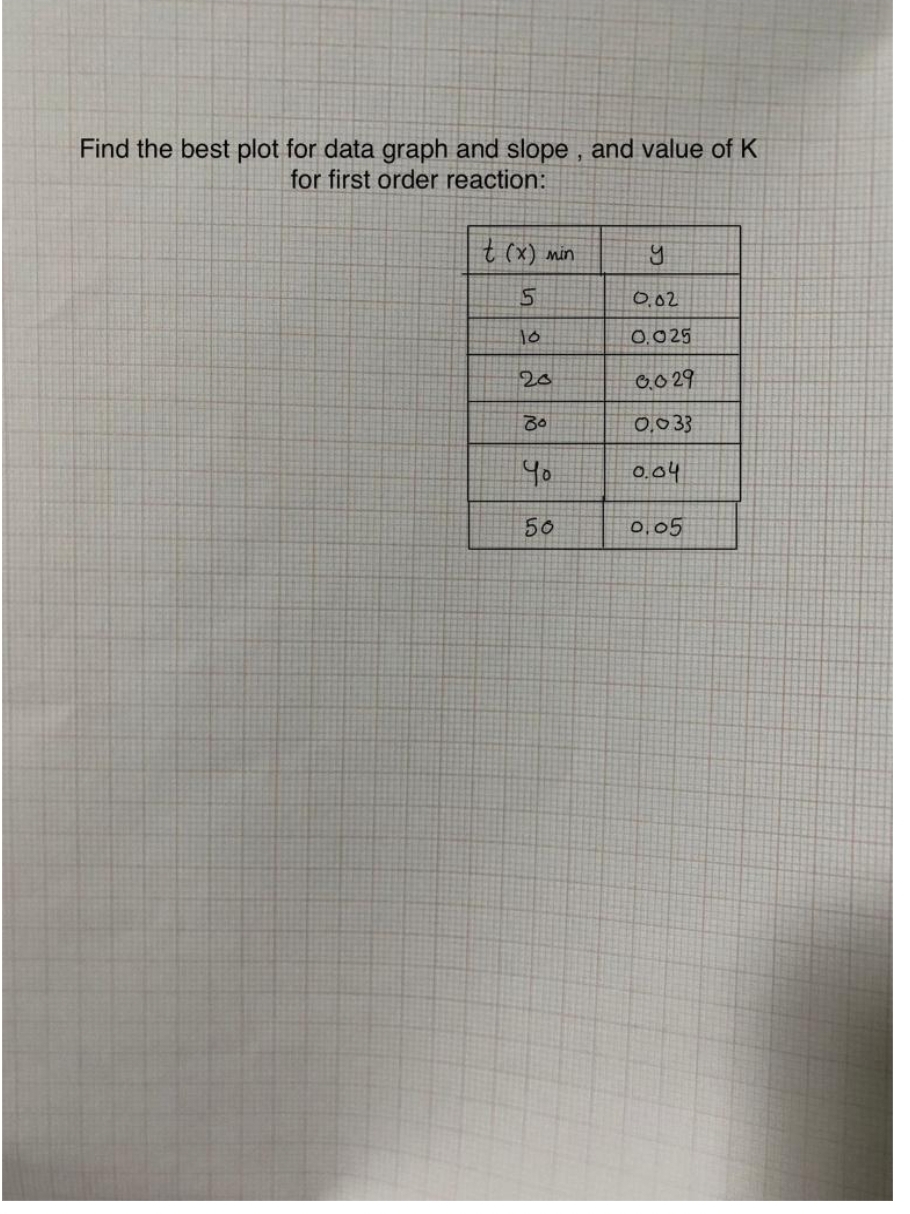
Transcribed Image Text:Find the best plot for data graph and slope, and value of K
for first order reaction:
t (x) min
5
10
20
80
Yo
50
y
0.02
0.025
0029
0,033
0.04
0.05
Expert Solution
This question has been solved!
Explore an expertly crafted, step-by-step solution for a thorough understanding of key concepts.

Step by step
Solved in 3 steps with 3 images

Knowledge Booster


Learn more about
Need a deep-dive on the concept behind this application? Look no further. Learn more about this topic, chemistry and related others by exploring similar questions and additional content below.Recommended textbooks for you
Physical Chemistry
Chemistry
ISBN:
9781133958437
Author:
Ball, David W. (david Warren), BAER, Tomas
Publisher:
Wadsworth Cengage Learning,


Principles of Modern Chemistry
Chemistry
ISBN:
9781305079113
Author:
David W. Oxtoby, H. Pat Gillis, Laurie J. Butler
Publisher:
Cengage Learning
Physical Chemistry
Chemistry
ISBN:
9781133958437
Author:
Ball, David W. (david Warren), BAER, Tomas
Publisher:
Wadsworth Cengage Learning,
Principles of Modern Chemistry
Chemistry
ISBN:
9781305079113
Author:
David W. Oxtoby, H. Pat Gillis, Laurie J. Butler
Publisher:
Cengage Learning