Find the chitical Value(s) and rejection region(s) for the type of z-test with level of significance a. Include a graph with your answer. Two-tailed test, a= 0.05
Find the chitical Value(s) and rejection region(s) for the type of z-test with level of significance a. Include a graph with your answer. Two-tailed test, a= 0.05

Big Ideas Math A Bridge To Success Algebra 1: Student Edition 2015
1st Edition
ISBN:9781680331141
Author:HOUGHTON MIFFLIN HARCOURT
Publisher:HOUGHTON MIFFLIN HARCOURT
Chapter11: Data Analysis And Displays
Section: Chapter Questions
Problem 10CT

Related questions
Question
Answer these question
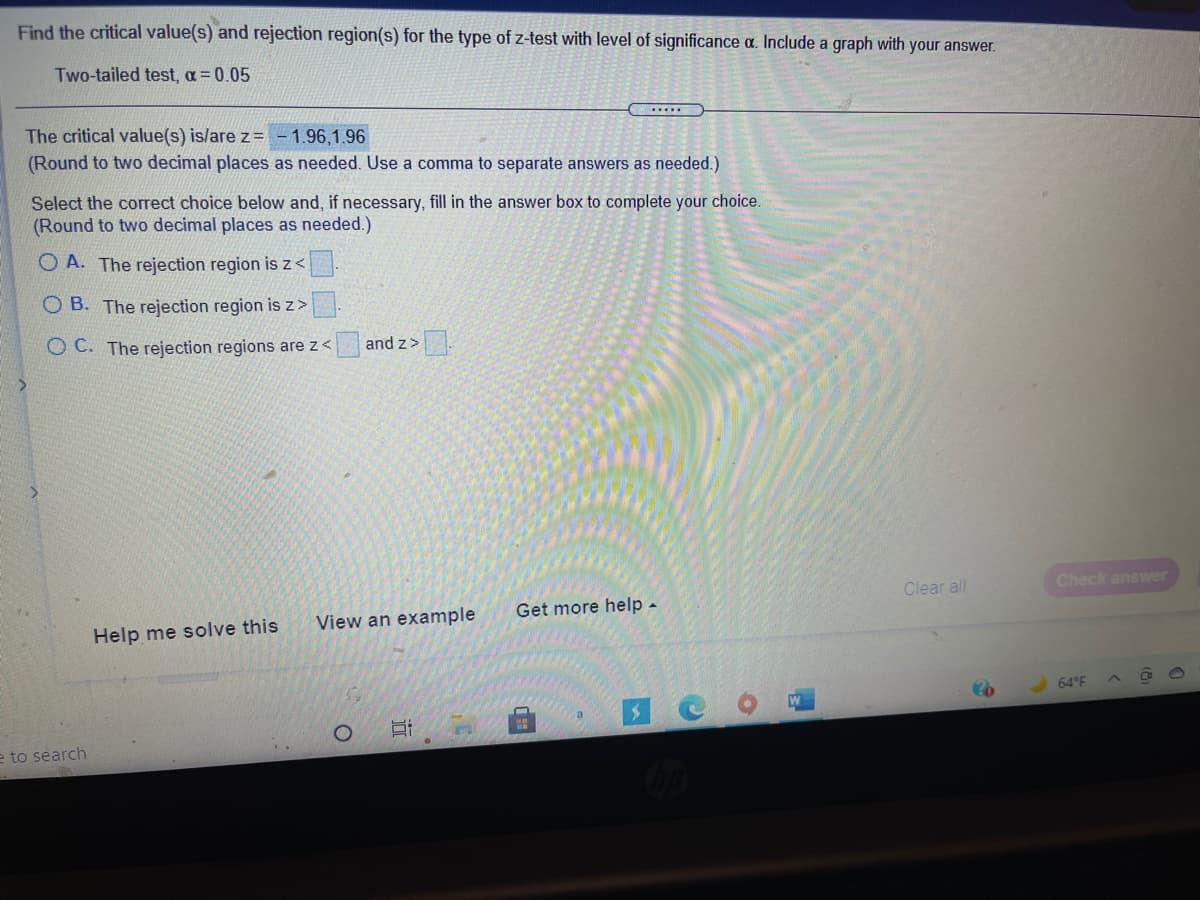
Transcribed Image Text:Find the critical value(s) and rejection region(s) for the type of z-test with level of significance a. Include a graph with your answer.
Two-tailed test, a = 0.05
.....
The critical value(s) is/are z=
(Round to two decimal places as needed. Use a comma to separate answers as needed.)
1.96,1.96
Select the correct choice below and, if necessary, fill in the answer box to complete your choice.
(Round to two decimal places as needed.)
O A. The rejection region is z<
O B. The rejection region is z>
O C. The rejection regions are z<
and z>.
Clear all
Check answer
View an example
Get more help.
Help me solve this
64°F
e to search
Expert Solution
This question has been solved!
Explore an expertly crafted, step-by-step solution for a thorough understanding of key concepts.

Step by step
Solved in 2 steps with 1 images

Recommended textbooks for you
Big Ideas Math A Bridge To Success Algebra 1: Stu…
Algebra
ISBN:
9781680331141
Author:
HOUGHTON MIFFLIN HARCOURT
Publisher:
Houghton Mifflin Harcourt
Big Ideas Math A Bridge To Success Algebra 1: Stu…
Algebra
ISBN:
9781680331141
Author:
HOUGHTON MIFFLIN HARCOURT
Publisher:
Houghton Mifflin Harcourt