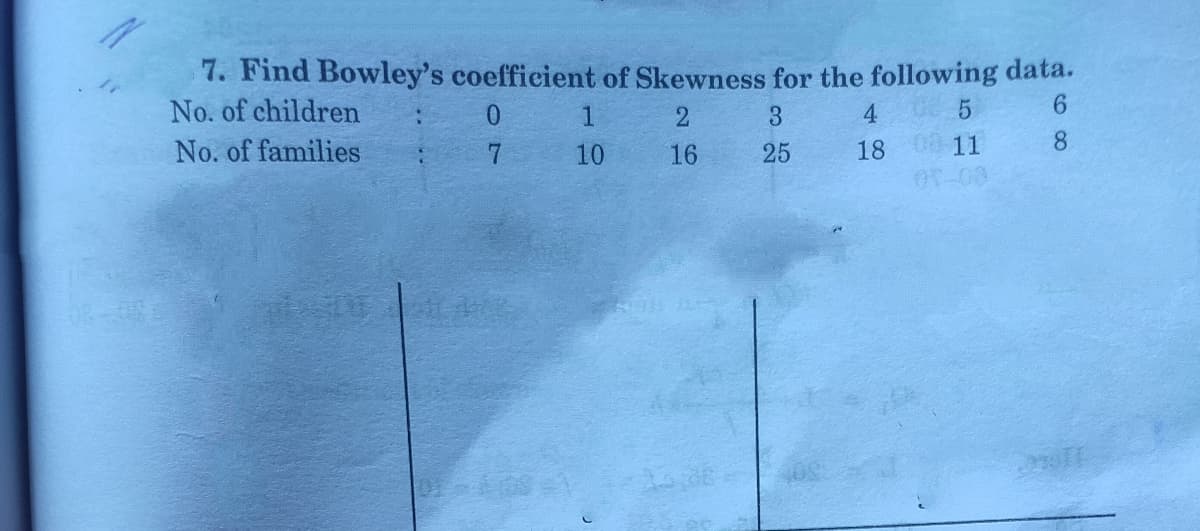
Find Bowley's coefficient of Skewness for the following data.


Q: Determine the two values of z such that the middle 58% of the data lie between the two z-values.
A:
Q: following data
A: From the given question, we have the line of best fit as: We will make use of this regression line…
Q: Below is a scatter plot with both a linear model and an exponential model for another group's data…
A: Note: Hi there! Thank you for posting the question. As your question has more than 3 parts, we have…
Q: * * * 23. Calculate the coefficient of skewness from the following data : 20 18 Mid-point: Frequency…
A:
Q: From the following two cases find out whether the data are consistent or not : Case I (A) 100, (B) =…
A:
Q: Calculate Karl Pearson's coefficient of skewness of the following data : 25 15 23 40 27 25 23 25 20
A:
Q: Compute the coefficient of variation of each data. Which of the two twine types is more uniform in…
A: Mean: For a set of n observations, x1, x2, ... , xn, mean is given by, Standard deviation: For a…
Q: Find the correlation coefficient for each of the two data sets shown below. (a) (c)
A: Given: (a) x y 1 5 1 3 1 5 1 7 2 3 2 3 2 1 3 1 3 1 4 1 (c) x y 1 2…
Q: 1. Consider the following data:
A: Given, x -0.5 -0.2 0.2 0.7 f(x) 1.2840 1.1052 0.9048 0.7047
Q: From the following data of age of employecs, calculate coefficient Example: of skewness and comment…
A: Mean = ΣXi*fi/Σfi = (25*8+30*20+35*40+40*65+45*80+50*92+55*100)/(8+20+40+65+80+92+100) = 45.679 Here…
Q: Here is a bivariate data set. 60 33 82 61 45 51 68 68 84 66 13 58 80 58 62 65 67 23 Find the…
A: To find the correlation coefficient for the given data: Correlation coefficient is a measure which…
Q: Calculate the coefficient of skewness from the following data: Mid-point : 15 20 25 30 35 40…
A:
Q: Match each scatterplot shown below with one of the four specified correlations.
A: Scatter Plot: Scatter plot is the graphical representation of the relationship between two variables…
Q: Calculate Bowley's coefficient of skewness from the following Example data : Sales No. of Companies…
A: Solution is given: Hope the answer is helpful for you.
Q: Match the correlation coefficients with the scatterplots shown below.
A:
Q: Find the variance of the following data. Round your answer to one decimal place.
A: Our aim is to find the variance.
Q: Then the variance of Y is
A: Given, E(Y/X=x)=2xvar(Y/X=x)=4x2 f(x)=1, 0<x<10, e.w
Q: If the Pearson coefficient of skewness for a data set is 1.945, what can be concluded about the data…
A: GIVEN: Pearson coefficient of skewnes for a data is Sk=1.945 Then data is 1): right skewed 2):…
Q: What is the value of SP for the following set of data? 4 X 11 NN
A: SP means the sum of products.
Q: Use the following data to determine the following. 2 4 8 10 7 5 3 a) Draw a scatter plot. b) Compute…
A: Correlation is the degree of relationship between two variables. Regression is used for estimating…
Q: Calculate the Regression Line and Correlation Coefficient for the following heights (inches) of…
A: Solution: 5. Let X be the height of father and Y be the height of their sons. From the given…
Q: (d) Guess the correlation coefficients for the following scatter plots. r= ?
A: Correlation: By correlation we mean the association or interdependence between two variables. If two…
Q: Consider the following scatter plots, number 1, 2, and 3 from left to right: 100 Which plot is most…
A: Correlation: Correlation a measure which indicates the “go-togetherness” of two data sets. It can be…
Q: Question 25: Here is a bivariate data set. x y 75.2 37
A: Given that Following Data for X & Y respectively :
Q: . Calculate the coefficient of skewness from the following data by using quartiles. Marks No. of…
A:
Q: Match each scatterplot shown below with one of the four specifi correlations. Do 88 of a. 0.74 b.…
A: Correlation: If the scatter plot shows a pattern of upward or downward straight line, it means that…
Q: Match each scatterplot shown below with one of the four specified correlations. a. 0.84
A:
Q: For the data below, compute the Pearson correlation. X Y 1 2 2 3 4 2 5 6 8 7
A: Enter the given data in Excel as follows:
Q: Which tests is the non-parametric equivalent of pearson r correlation? A. Kolmogrov B. Shapiro C.…
A: Non-parametric test: Non-parametric tests are experiments that do not require the underlying…
Q: Discuss the Skewness and Kurtosis and find the mean and the variance for the following ungrouped…
A: From the given information we want to find skewness, kurtosis and mean variance.
Q: Estimate the correlation depicted by the following scatterplot:
A: Here given the Scatter plot
Q: The following calculator screenshots show the scatterplot and the correlation coefficient between…
A: Correlation: A statistical method that is applied between the pairs of variables to check how the…
Q: Calculate the Regression Line and Correlation Coefficient for the following heights (inches) of…
A: The independent variable is heights of father (X) in inches , and the dependent variable is heights…
Q: For the data points in question number 5: What is the value for r2 for the best fit curve?
A: Given the scatter diagram containing 8 data points. x y -5.5 -8 -4.9 -5.3 -3.7 -3.2 -2…
Q: 2. Calculate Karl-person's coefficient of skewness for the following data. 25,15,23, 40, 27, 25, 23,…
A: Given: 25 15 23 40 27 25 23 25 20
Q: For the data below, compute the Pearson correlation. By hand X Y 1 2 2 3 4 2 5 6 8 7
A: Solution: The given data is
Q: Identify the type of correlation in the following scatter plot.
A: Scatter plot is used to show the relationship between two continuous variable X and Y.
Q: . (a) Calculate correlation and regression coefficient from the following data: 14 2 6 8 10 12 4 2 5…
A:
Q: Suppose that for a set of (x,y) data, r² = 0.2916. Find the linear correlation coefficient. Do not…
A: Provided information: For a set of (x,y) data,r2 = 0.2916
Q: and the r = 0.4096. What is the correlation coefficient for this data set? r =
A: Given that Coefficient of determination (r2) = 0.4096 We know that Correlation coefficient (r) =…
Q: Let wages denote hourly wages, educ years of education, and exper years of experience, and suppose…
A: It is an important part of statistics . It is widely used .
Q: Find the Pearson's coefficient of skewness of the following set of data. Data 11 13 15 18 22 23 24…
A: Given samples data : 11, 13, 15, 18, 22, 23, 24, 26, 26, 26, 32, 34, 36, 37, 43, 44, 48, 48, 49, 53,…
Q: Consider the following data points, where the first coordinate corresponds to x and the second…
A: From the given information, Variance of b1 is 0.25 The t statistic associated to b1 is equal to…
Q: Consider the following scatter and residual plots:
A: Correlation is a relationship that is quantitative in nature and is being measured in terms of…
Q: use the data to calculate tukey test, Fisher LSD and Dunnet test
A: Given: Summer Shoulder Winter 83 91 94 85 87 91 85 84 87 87 87 85 90 85 87 88 86…
Q: The following calculator screenshots show the scatterplot and the correlation coefficient between…
A: From the diagram, we can see that as the number of days absent increases, their grades are…
Q: Ms. Johnson uses a statistics program to analyze all the data collected by her students during a lab…
A: topic- statistics
Q: Using the same data as question (included below), determine the coefficient of determination. Re
A: The coefficient of determination can be obtained by calculating and squaring the correlation…


Trending now
This is a popular solution!

Step by step
Solved in 3 steps with 2 images
