Find the critical value t, for the confidence level c=0.98 and sample size n =21.

MATLAB: An Introduction with Applications
6th Edition
ISBN:9781119256830
Author:Amos Gilat
Publisher:Amos Gilat
Chapter1: Starting With Matlab
Section: Chapter Questions
Problem 1P

Related questions
Topic Video
Question
Transcribed Image Text:9:19 PM Sun Apr 4
A mathxl.com
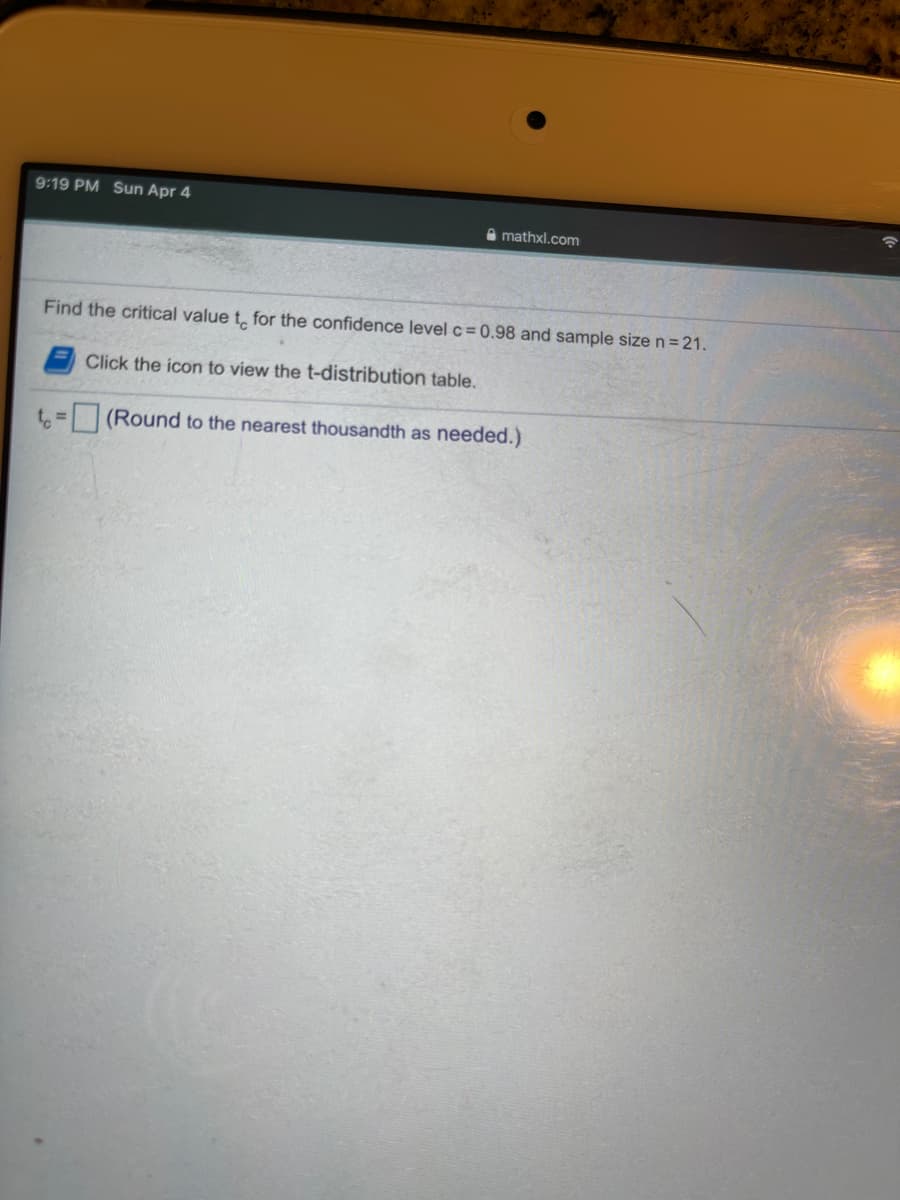
Find the critical value t, for the confidence level c= 0.98 and sample size n= 21.
Click the icon to view the t-distribution table.
t = |(Round to the nearest thousandth as needed.)
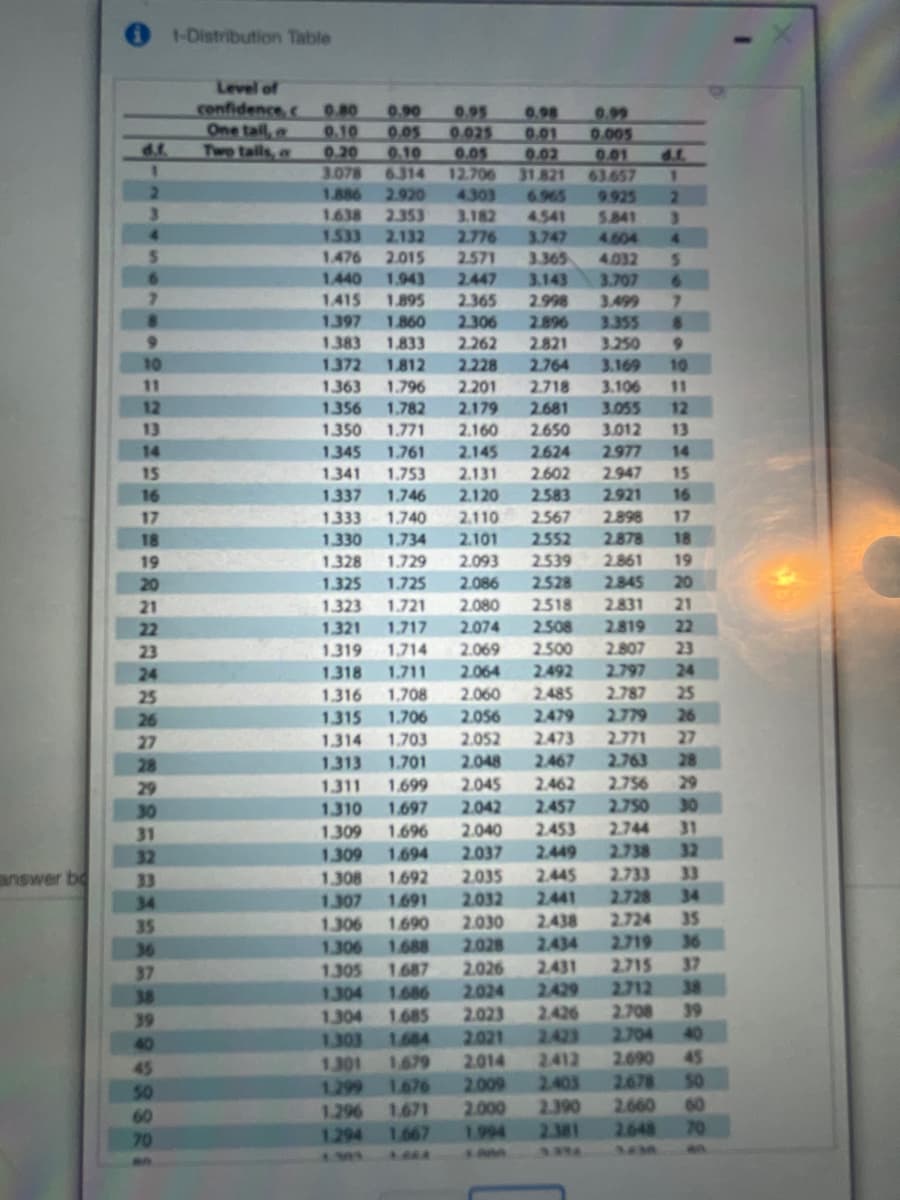
Transcribed Image Text:1-Distribution Table
Level of
confidence, c
One tal,
Two tails, a
0.80
0.10
0.20
3.078
1.886
0.90
0.05
0.10
6314
0.95
0.025
0.05
0.98
0.01
0.02
31821
6.965
0.99
0.005
0.01
d.r
dr.
63.657
12.706
4303
3.182
2.776
2.571
1.
2.920
9.925
S341
3.
1638
1533
1.476
1.440
2.353
2.132
2.015
4.541
3.747
4.604
4.
3.365
3.143
2.998
2.896
2.821
4.032
2.447
2.365
2.306
2.262
1.943
1.895
3.707
6.
7.
1.415
3.499
7.
3.355
3.250
1.397
1.860
1383
1.372
1.833
9.
10
2.228
2.201
2.179
1.812
2.764
3.169
10
11
1.796
2.718
2.681
3.106
3.055
3.012
1363
11
12
1.356
1.782
12
13
1350
771ה
2.160
2.650
13
14
1345
1.761
2.145
2.624
2.977
14
15
1.341
1.753
2.131
2.602
2.947
15
16
1.337
1.746
2.120
2.583
2.921
16
2.898
2.878
2.861
2.845
2.831
2.819
2.807
17
1333
1.740
2.110
2567
17
18
1.330
1.734
2.101
2.552
18
2.539
2.528
2518
2.508
19
1.328
1.729
2.093
19
1.725
1.721
20
1.325
2.086
20
21
1.323
2.080
21
22
1.321
1.717
2.074
22
23
1.319 1.714
2.069
2.500
23
24
1.318
1.711
2.064
2.492
2.797
24
2.485
2.479
2.060
2.787
25
1.316
1.315
25
1,708
1.706
1.703
1.701
2.779
26
27
26
2.056
2.052
2.048
2.473
2.771
1.314
1.313
27
2.763
2.756
2.750
2.744
2.467
2.462
28
28
29
1311
1.699
2.045
29
30
1.310
1.697
2.042
2.457
30
2.453
2.449
31
1.309
1.696
2.040
31
2.738
2.733
2.728
32
2.037
2.035
1.309
1.694
32
33
33
34
2.445
answer b
1.308
1.307
1.692
1.691
34
2.032
2,441
2.438
2.724
35
1.690
1.688
35
1.306
2.030
2.434
2.431
2.429
2.426
2.423
36
2.719
2.715
37
2.712
36
1.306
2.028
2.026
1.305
1304
1.304
1303
1301
1.299
1.687
37
38
1.686
2.024
38
2.023
2.708
39
39
40
1.685
1684
2.021
2.704
40
2.690
45
2.014
2.009
2.000
2.412
2.403
2.390
1679
45
50
60
70
1676
2.678
50
2.660
60
1.296
1294
1671
1667
1.994
2.381
2.648
70
Expert Solution
This question has been solved!
Explore an expertly crafted, step-by-step solution for a thorough understanding of key concepts.

This is a popular solution!

Trending now
This is a popular solution!

Step by step
Solved in 2 steps with 1 images

Knowledge Booster


Learn more about
Need a deep-dive on the concept behind this application? Look no further. Learn more about this topic, statistics and related others by exploring similar questions and additional content below.Recommended textbooks for you
MATLAB: An Introduction with Applications
Statistics
ISBN:
9781119256830
Author:
Amos Gilat
Publisher:
John Wiley & Sons Inc

Probability and Statistics for Engineering and th…
Statistics
ISBN:
9781305251809
Author:
Jay L. Devore
Publisher:
Cengage Learning

Statistics for The Behavioral Sciences (MindTap C…
Statistics
ISBN:
9781305504912
Author:
Frederick J Gravetter, Larry B. Wallnau
Publisher:
Cengage Learning
MATLAB: An Introduction with Applications
Statistics
ISBN:
9781119256830
Author:
Amos Gilat
Publisher:
John Wiley & Sons Inc
Probability and Statistics for Engineering and th…
Statistics
ISBN:
9781305251809
Author:
Jay L. Devore
Publisher:
Cengage Learning
Statistics for The Behavioral Sciences (MindTap C…
Statistics
ISBN:
9781305504912
Author:
Frederick J Gravetter, Larry B. Wallnau
Publisher:
Cengage Learning

Elementary Statistics: Picturing the World (7th E…
Statistics
ISBN:
9780134683416
Author:
Ron Larson, Betsy Farber
Publisher:
PEARSON

The Basic Practice of Statistics
Statistics
ISBN:
9781319042578
Author:
David S. Moore, William I. Notz, Michael A. Fligner
Publisher:
W. H. Freeman

Introduction to the Practice of Statistics
Statistics
ISBN:
9781319013387
Author:
David S. Moore, George P. McCabe, Bruce A. Craig
Publisher:
W. H. Freeman