Find the critical value(s) and rejection region(s) for the indicated t-test, level of significance a, and sample size n. O t-Distribution Table Left-tailed test, a 0.01, n 16 A Click the icon to view the t-distribution table. Level of confidence, c 0.80 One tail, a Two tails, a 0.90 0.95 0.025 0.98 0.99 0.005 The critical value(s) is/are 0.10 0.05 0.01 (Round to the nearest thousandth as needed. Use a comma to separate answers as needed.) d.f. 0.20 0.10 d.f. 0.05 0.02 12.706 31.821 0.01 1 3.078 6.314 63.657 1. Determine the rejection region(s). Select the correct choice below and fill in the answer box(es) within your choice. (Round to the nearest thousandth as needed.) 2. 1.886 2.920 4.303 6.965 9.925 2. 3 1.638 2.353 3.182 4.541 5.841 3 O A. 1< O B. 1.476 2.015 3.365 4.032 OC. t> O D. t< 6. 1,440 1.943 2.447 3.143 3.707 6. 1.415 7. 1.895 1.860 1.833 2.365 2.998 3.499 3.355 6. 1.397 2.306 2.262 8. 2.896 8. 9. 1.383 2.821 3.250 2.228 2.764 3.169 3.106 3.055 10 1.372 1.812 10 11 1.363 1.796 2.201 2.718 11 12 1.356 1350 12 1.782 2.179 2.681 13 1.771 2.160 2.650 3.012 13 14 1.345 1.761 2.145 2.624 2.977 14 2.131 2.120 2.602 2.583 15 1341 1.753 2.947 15 1.337 1.746 1.70 16 2.921 16 1.333 2.898 17 2.110 2.101 2.567 2.552 17 18 1.330 1.734 2.878 18 19 1.328 1.729 2.093 2.539 2.861 19 20 1.325 1.725 2.086 2528 2.845 20 1.721 2.080 2.518 21 2.831 2.819 2.807 21 1.323 1.321 1.712 1.714 2508 22 23 2.074 2.069 2.064 22 23 2.500 1.319 1.318 1.711 2.492 2.797 24 24 25 2.485 2.787 25 1.316 1.315 1.708 1.706 2.060 2.056 26 2.479 2.779 26 Print Done Click to select your answer(s).
Find the critical value(s) and rejection region(s) for the indicated t-test, level of significance a, and sample size n. O t-Distribution Table Left-tailed test, a 0.01, n 16 A Click the icon to view the t-distribution table. Level of confidence, c 0.80 One tail, a Two tails, a 0.90 0.95 0.025 0.98 0.99 0.005 The critical value(s) is/are 0.10 0.05 0.01 (Round to the nearest thousandth as needed. Use a comma to separate answers as needed.) d.f. 0.20 0.10 d.f. 0.05 0.02 12.706 31.821 0.01 1 3.078 6.314 63.657 1. Determine the rejection region(s). Select the correct choice below and fill in the answer box(es) within your choice. (Round to the nearest thousandth as needed.) 2. 1.886 2.920 4.303 6.965 9.925 2. 3 1.638 2.353 3.182 4.541 5.841 3 O A. 1< O B. 1.476 2.015 3.365 4.032 OC. t> O D. t< 6. 1,440 1.943 2.447 3.143 3.707 6. 1.415 7. 1.895 1.860 1.833 2.365 2.998 3.499 3.355 6. 1.397 2.306 2.262 8. 2.896 8. 9. 1.383 2.821 3.250 2.228 2.764 3.169 3.106 3.055 10 1.372 1.812 10 11 1.363 1.796 2.201 2.718 11 12 1.356 1350 12 1.782 2.179 2.681 13 1.771 2.160 2.650 3.012 13 14 1.345 1.761 2.145 2.624 2.977 14 2.131 2.120 2.602 2.583 15 1341 1.753 2.947 15 1.337 1.746 1.70 16 2.921 16 1.333 2.898 17 2.110 2.101 2.567 2.552 17 18 1.330 1.734 2.878 18 19 1.328 1.729 2.093 2.539 2.861 19 20 1.325 1.725 2.086 2528 2.845 20 1.721 2.080 2.518 21 2.831 2.819 2.807 21 1.323 1.321 1.712 1.714 2508 22 23 2.074 2.069 2.064 22 23 2.500 1.319 1.318 1.711 2.492 2.797 24 24 25 2.485 2.787 25 1.316 1.315 1.708 1.706 2.060 2.056 26 2.479 2.779 26 Print Done Click to select your answer(s).

MATLAB: An Introduction with Applications
6th Edition
ISBN:9781119256830
Author:Amos Gilat
Publisher:Amos Gilat
Chapter1: Starting With Matlab
Section: Chapter Questions
Problem 1P

Related questions
Topic Video
Question
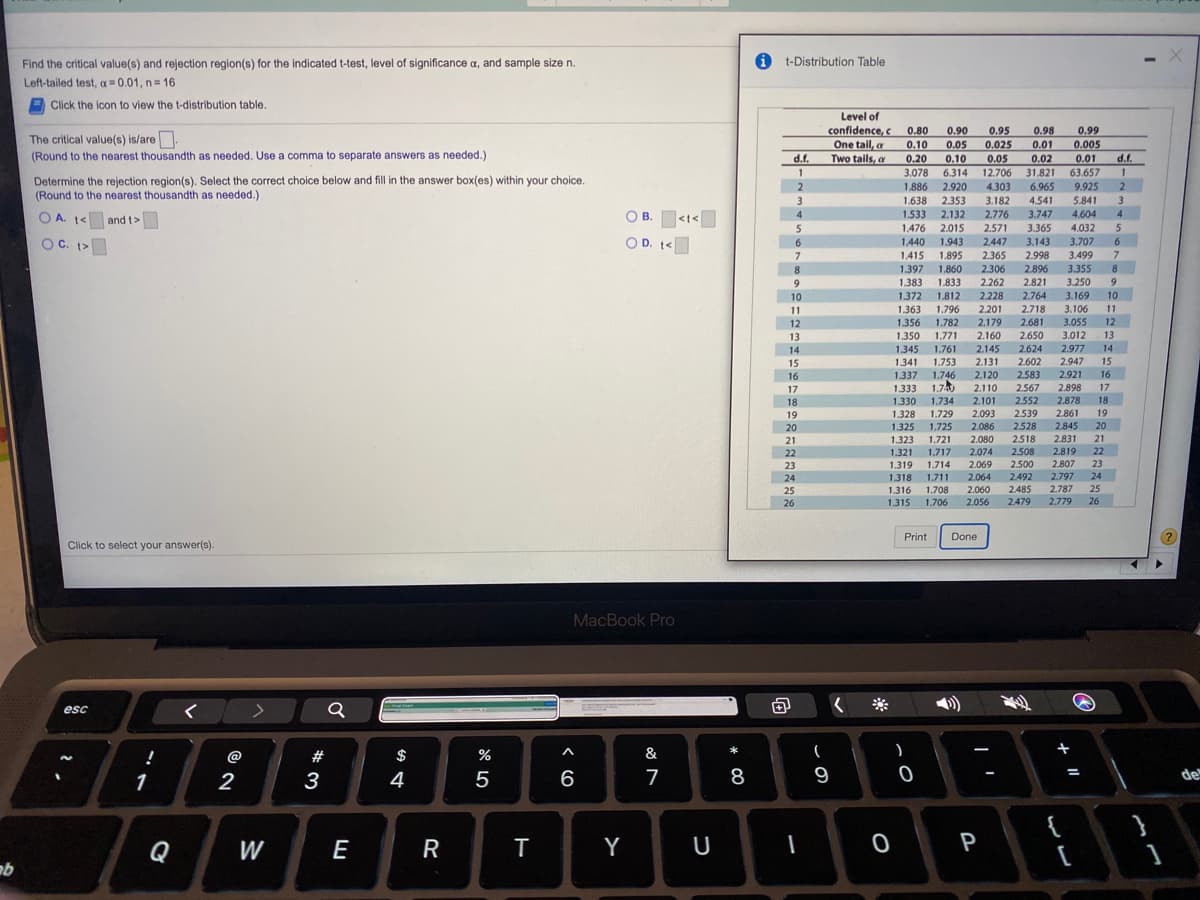
Transcribed Image Text:Find the critical value(s) and rejection region(s) for the indicated t-test, level of significance a, and sample size n.
i t-Distribution Table
Left-tailed test, a 0.01, n 16
A Click the icon to view the t-distribution table.
Level of
confidence, c 0.80
One tail, a
Two tails, a
0.90
0.95
0.025
0.98
0.99
The critical value(s) is/are.
(Round to the nearest thousandth as needed. Use a comma to separate answers as needed.)
0.10
0.05
0.01
0.005
d.f.
d.f.
0.20
3.078
0.10
0.05
0.02
0.01
1
6.314
12.706
31.821
63.657
1
Determine the rejection region(s). Select the correct choice below and fill in the answer box(es) within your choice.
(Round to the nearest thousandth as needed.)
2.
1.886 2.920
4.303
6.965
9.925
3
1,638
2.353
3.182
4.541
5.841
O B. <t<
O D. t<
O A. 1<
1.533
2.132
2.776
3.747
4.604
4
В.
4.
and t>
1.476
2.015
2.571
3.365
4.032
5
OC. t>
6.
1.440
1.943
2.447
3.143
3.707
6
1.415
1.895
2.365
2.998
3.499
7.
8.
1.397
1.860
2.306
2.896
3.355
8
9
1.383
1.833
2.262
2.821
3.250
1.812
2.228
2.201
2.179
10
1.372
2.764
3.169
10
1.796
1.782
11
1.363
2.718
3.106
11
12
1.356
2.681
3.055
12
13
1.350
1.771
2.160
2.650
3.012
13
14
1.345
1.761
2.145
2.624
2.977
14
15
1.341
1.753
2.131
2.602
2.947
15
1.337
16
1.746
1.70
1.734
1.729
2.120
2.583
2.921
2.898
2.878
2.861
16
2.110
17
1.333
1.330
2.567
2.552
17
18
2.101
18
19
1.328
2,093
2.539
19
20
1.325
1.725
2,086
2.528
2.845
20
21
1.323
1,721
2.080
2518
2.831
21
22
1.321
1.717
2.074
2.508
2.819
22
23
1.319
1.714
2.069
2500
2.807
23
24
1.318 1.711
2.064
2.492
2.797
24
2.060
2.485
2.787
25
25
26
1.316
1.708
1.315 1.706
2.056
2.479
2.779
26
Print
Done
Click to select your answer(s).
MacBook Pro
esc
@
#
$
&
*
3
4
6
7
8
9
de
{
Q
W
E
R
Y
U
P
-
Expert Solution
This question has been solved!
Explore an expertly crafted, step-by-step solution for a thorough understanding of key concepts.

This is a popular solution!

Trending now
This is a popular solution!

Step by step
Solved in 2 steps

Knowledge Booster


Learn more about
Need a deep-dive on the concept behind this application? Look no further. Learn more about this topic, statistics and related others by exploring similar questions and additional content below.Recommended textbooks for you
MATLAB: An Introduction with Applications
Statistics
ISBN:
9781119256830
Author:
Amos Gilat
Publisher:
John Wiley & Sons Inc

Probability and Statistics for Engineering and th…
Statistics
ISBN:
9781305251809
Author:
Jay L. Devore
Publisher:
Cengage Learning

Statistics for The Behavioral Sciences (MindTap C…
Statistics
ISBN:
9781305504912
Author:
Frederick J Gravetter, Larry B. Wallnau
Publisher:
Cengage Learning
MATLAB: An Introduction with Applications
Statistics
ISBN:
9781119256830
Author:
Amos Gilat
Publisher:
John Wiley & Sons Inc
Probability and Statistics for Engineering and th…
Statistics
ISBN:
9781305251809
Author:
Jay L. Devore
Publisher:
Cengage Learning
Statistics for The Behavioral Sciences (MindTap C…
Statistics
ISBN:
9781305504912
Author:
Frederick J Gravetter, Larry B. Wallnau
Publisher:
Cengage Learning

Elementary Statistics: Picturing the World (7th E…
Statistics
ISBN:
9780134683416
Author:
Ron Larson, Betsy Farber
Publisher:
PEARSON

The Basic Practice of Statistics
Statistics
ISBN:
9781319042578
Author:
David S. Moore, William I. Notz, Michael A. Fligner
Publisher:
W. H. Freeman

Introduction to the Practice of Statistics
Statistics
ISBN:
9781319013387
Author:
David S. Moore, George P. McCabe, Bruce A. Craig
Publisher:
W. H. Freeman