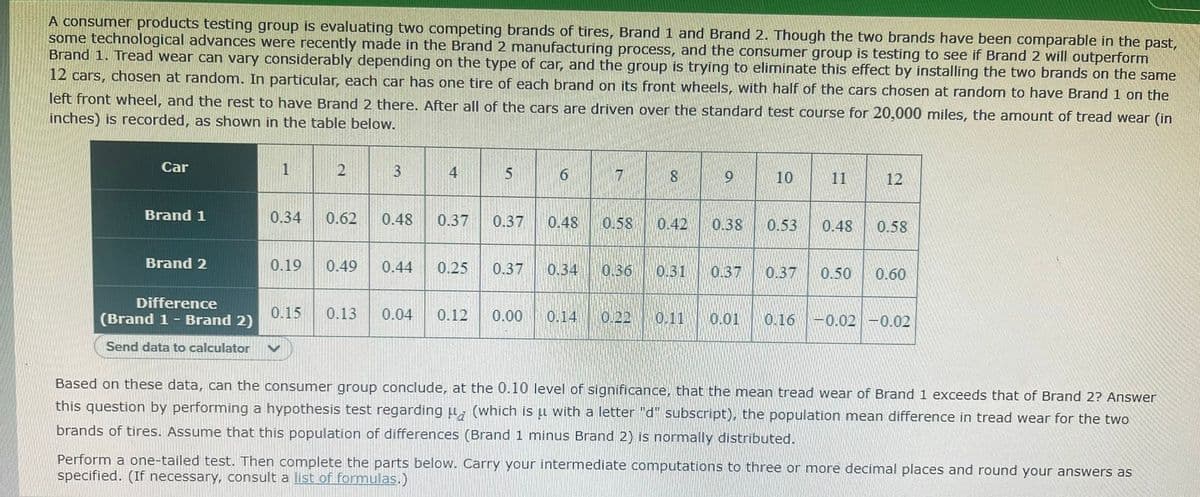
A consumer products testing group is evaluating two competing brands of tires, Brand 1 and Brand 2. Though the two brands have been comparable in the pa some technological advances were recently made in the Brand 2 manufacturing process, and the consumer group is testing to see if Brand 2 will outperform Brand 1. Tread wear can vary considerably depending on the type of car, and the group is trying to eliminate this effect by installing the two brands on the sar 12 cars, chosen at random. In particular, each car has one tire of each brand on its front wheels, with half of the cars chosen at random to have Brand 1 on th left front wheel, and the rest to have Brand 2 there. After all of the cars are driven over the standard test course for 20,000 miles, the amount of tread wear C inches) is recorded, as shown in the table below. Car 1 3 4 8 9. 10 11 12 Brand 1 0.34 0.62 0.48 0.37 0.37 0.48 0.58 0.42 0.38 0.53 0.48 0.58 Brand 2 0.19 0.49 0.44 0.25 0.37 0.34 0.36 0.31 0.37 0.37 0.50 0.60
A consumer products testing group is evaluating two competing brands of tires, Brand 1 and Brand 2. Though the two brands have been comparable in the pa some technological advances were recently made in the Brand 2 manufacturing process, and the consumer group is testing to see if Brand 2 will outperform Brand 1. Tread wear can vary considerably depending on the type of car, and the group is trying to eliminate this effect by installing the two brands on the sar 12 cars, chosen at random. In particular, each car has one tire of each brand on its front wheels, with half of the cars chosen at random to have Brand 1 on th left front wheel, and the rest to have Brand 2 there. After all of the cars are driven over the standard test course for 20,000 miles, the amount of tread wear C inches) is recorded, as shown in the table below. Car 1 3 4 8 9. 10 11 12 Brand 1 0.34 0.62 0.48 0.37 0.37 0.48 0.58 0.42 0.38 0.53 0.48 0.58 Brand 2 0.19 0.49 0.44 0.25 0.37 0.34 0.36 0.31 0.37 0.37 0.50 0.60

Holt Mcdougal Larson Pre-algebra: Student Edition 2012
1st Edition
ISBN:9780547587776
Author:HOLT MCDOUGAL
Publisher:HOLT MCDOUGAL
Chapter11: Data Analysis And Probability
Section11.8: Probabilities Of Disjoint And Overlapping Events
Problem 2C

Related questions
Question
Transcribed Image Text:A consumer products testing group is evaluating two competing brands of tires, Brand 1 and Brand 2. Though the two brands have been comparable in the past,
some technological advances were recently made in the Brand 2 manufacturing process, and the consumer group is testing to see if Brand 2 will outperform
Brand 1. Tread wear can vary considerably depending on the type of car, and the group is trying to eliminate this effect by installing the two brands on the same
12 cars, chosen at random. In particular, each car has one tire of each brand on its front wheels, with half of the cars chosen at random to have Brand 1 on the
left front wheel, and the rest to have Brand 2 there. After all of the cars are driven over the standard test course for 20,000 miles, the amount of tread wear (in
inches) is recorded, as shown in the table below.
Car
1
4
6.
8.
10
11
12
Brand 1
0.34
0.62
0.48
0.37
0.37
0.48
0.58
0.42
0.38
0.53
0.48
0.58
Brand 2
0.19
0.49
0.44
0.25
0.37
0.34
0.36
131
0.37
0.37
0.50
0.60
Difference
(Brand 1 - Brand 2)
0.15
0.13
0.04
0.12
0.00
0.14
0.22
0.11
0.01
0.16
-0.02 -0.02
Send data to calculator
Based on these data, can the consumer group conclude, at the 0.10 level of significance, that the mean tread wear of Brand 1 exceeds that of Brand 2? Answer
this question by performing a hypothesis test regarding u, (which is u with a letter "d" subscript), the population mean difference in tread wear for the two
brands of tires. Assume that this population of differences (Brand 1 minus Brand 2) is normally distributed.
Perform a one-tailed test. Then complete the parts below. Carry your intermediate computations to three or more decimal places and round your answers as
specified. (If necessary, consult a list of formulas.)
9.
Transcribed Image Text:specified. (If necessary, consult a list of formulas.)
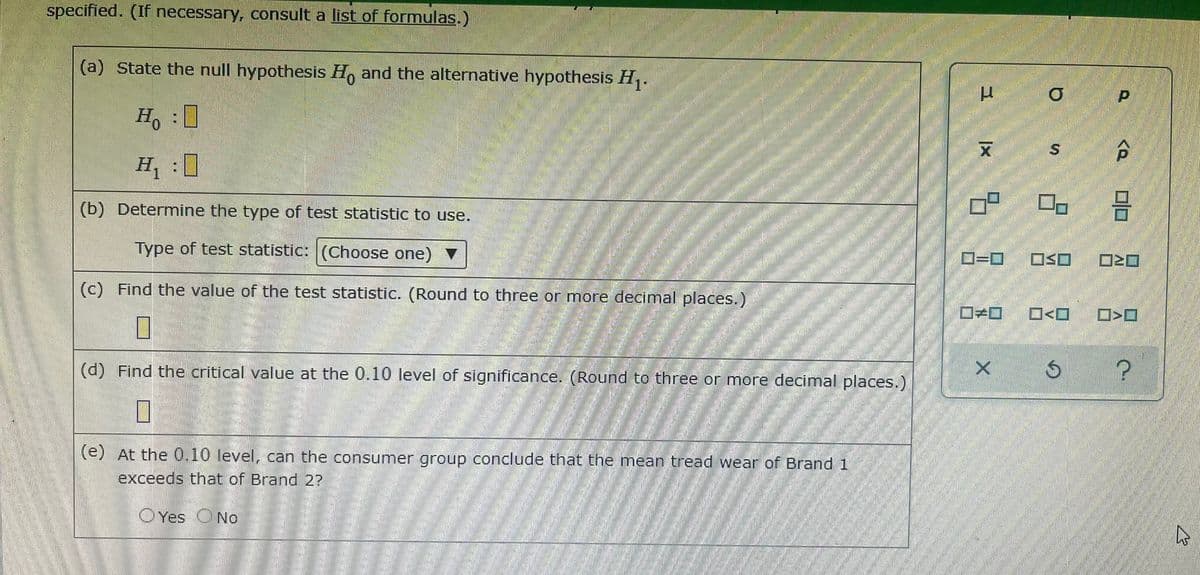
(a) State the null hypothesis H, and the alternative hypothesis H,.
Ho :0
(b) Determine the type of test statistic to use.
Type of test statistic: (Choose one) V
D=0
(c) Find the value of the test statistic. (Round to three or more decimal places.)
O<O
(d) Find the critical value at the 0.10 level of significance. (Round to three or more decimal places.)
(e) At the 0.10 level, can the consumer group conclude that the mean tread wear of Brand 1
exceeds that of Brand 2?
O Yes O No
Expert Solution
This question has been solved!
Explore an expertly crafted, step-by-step solution for a thorough understanding of key concepts.

This is a popular solution!

Trending now
This is a popular solution!

Step by step
Solved in 2 steps

Recommended textbooks for you
Holt Mcdougal Larson Pre-algebra: Student Edition…
Algebra
ISBN:
9780547587776
Author:
HOLT MCDOUGAL
Publisher:
HOLT MCDOUGAL

Algebra & Trigonometry with Analytic Geometry
Algebra
ISBN:
9781133382119
Author:
Swokowski
Publisher:
Cengage
Holt Mcdougal Larson Pre-algebra: Student Edition…
Algebra
ISBN:
9780547587776
Author:
HOLT MCDOUGAL
Publisher:
HOLT MCDOUGAL
Algebra & Trigonometry with Analytic Geometry
Algebra
ISBN:
9781133382119
Author:
Swokowski
Publisher:
Cengage