Use the population of (46, 31, 24, 12) of the amounts of caffeine (mg/12 oz) in four beverages. Assume that random samples of size n=2 are selected with replacement. Complete parts (a) through (c) below. a. After identifying the 16 different possible samples and finding the mean of each sample, construct a table representing the sampling distribution of the sample mean. In the table, values of the sample mean that are the same have been combined. Probability Probability 46 27.5 38.5 24 35 21.5 31 18 29 12 (Type integers or fractions.) b. Compare the mean of the population to the mean of the sampling distribution of the sample mean. The mean of the population,. is the mean of the sample means, (Round to two decimal places as needed.) c. Do the sample means target the value of the population mean? In general, do sample means make good estimates of population means? Why or why not? The sample means V the population mean. In general, sample means V make good estimates of population means because the mean is estimator.
Use the population of (46, 31, 24, 12) of the amounts of caffeine (mg/12 oz) in four beverages. Assume that random samples of size n=2 are selected with replacement. Complete parts (a) through (c) below. a. After identifying the 16 different possible samples and finding the mean of each sample, construct a table representing the sampling distribution of the sample mean. In the table, values of the sample mean that are the same have been combined. Probability Probability 46 27.5 38.5 24 35 21.5 31 18 29 12 (Type integers or fractions.) b. Compare the mean of the population to the mean of the sampling distribution of the sample mean. The mean of the population,. is the mean of the sample means, (Round to two decimal places as needed.) c. Do the sample means target the value of the population mean? In general, do sample means make good estimates of population means? Why or why not? The sample means V the population mean. In general, sample means V make good estimates of population means because the mean is estimator.

Holt Mcdougal Larson Pre-algebra: Student Edition 2012
1st Edition
ISBN:9780547587776
Author:HOLT MCDOUGAL
Publisher:HOLT MCDOUGAL
Chapter11: Data Analysis And Probability
Section11.4: Collecting Data
Problem 1E

Related questions
Question
32 and 33 solve both
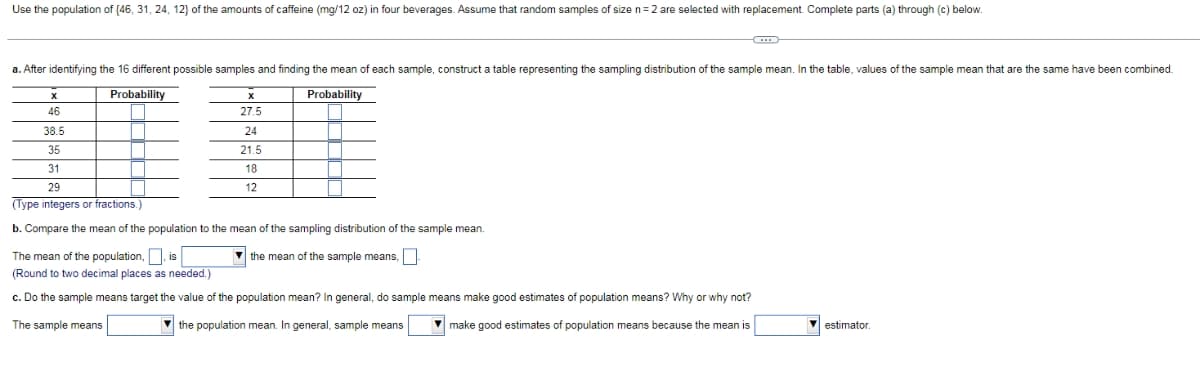
Transcribed Image Text:Use the population of (46, 31, 24, 12} of the amounts of caffeine (mg/12 oz) in four beverages. Assume that random samples of size n=2 are selected with replacement. Complete parts (a) through (c) below.
a. After identifying the 16 different possible samples and finding the mean of each sample, construct a table representing the sampling distribution of the sample mean. In the table, values of the sample mean that are the same have been combined.
Probability
Probability
46
27.5
38.5
24
35
21.5
31
18
29
12
(Type integers or fractions.)
b. Compare the mean of the population to the mean of the sampling distribution of the sample mean.
The mean of the population,, is
(Round to two decimal places as needed.)
v the mean of the sample means,
c. Do the sample means target the value of the population mean? In general, do sample means make good estimates of population means? Why or why not?
The sample means
V the population mean. In general, sample means
V make good estimates of population means because the mean is
V estimator.
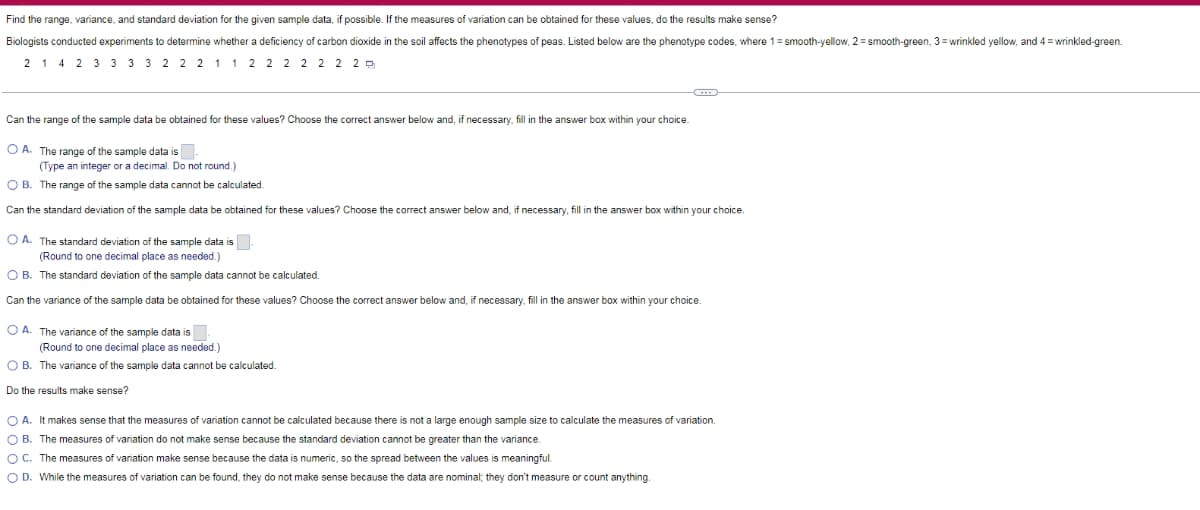
Transcribed Image Text:Find the range, variance, and standard deviation for the given sample data, if possible. If the measures of variation can be obtained for these values, do the results make sense?
Biologists conducted experiments to determine whether a deficiency of carbon dioxide in the soil affects the phenotypes of peas. Listed below are the phenotype codes, where 1= smooth-yellow, 2 = smooth-green, 3 = wrinkled yellow, and 4 = wrinkled-green.
2 1 4 2 3 3 3 3 2 2 2 1 1 2 2 2 2 2 2 2 P
Can the range of the sample data be obtained for these values? Choose the correct answer below and, if necessary, fill in the answer box within your choice.
O A. The range of the sample data is.
(Type an integer or a decimal. Do not round.)
O B. The range of the sample data cannot be calculated.
Can the standard deviation of the sample data be obtained for these values? Choose the correct answer below and, if necessary, fill in the answer box within your choice.
O A. The standard deviation of the sample data is.
(Round to one decimal place as needed.)
O B. The standard deviation of the sample data cannot be calculated.
Can the variance of the sample data be obtained for these values? Choose the correct answer below and, if necessary, fill in the answer box within your choice
O A. The variance of the sample data is
(Round to one decimal place as needed.)
O B. The variance of the sample data cannot be calculated.
Do the results make sense?
O A. It makes sense that the measures of variation cannot be calculated because there is not a large enough sample size to calculate the measures
variation.
O B. The measures of variation do not make sense because the standard deviation cannot be greater than the variance.
O C. The measures of variation make sense because the data is numeric, so the spread between the values is meaningful.
O D. While the measures of variation can be found, they do not make sense because the data are nominal; they don't measure or count anything.
Expert Solution
This question has been solved!
Explore an expertly crafted, step-by-step solution for a thorough understanding of key concepts.

This is a popular solution!

Trending now
This is a popular solution!

Step by step
Solved in 3 steps

Recommended textbooks for you
Holt Mcdougal Larson Pre-algebra: Student Edition…
Algebra
ISBN:
9780547587776
Author:
HOLT MCDOUGAL
Publisher:
HOLT MCDOUGAL

College Algebra (MindTap Course List)
Algebra
ISBN:
9781305652231
Author:
R. David Gustafson, Jeff Hughes
Publisher:
Cengage Learning
Holt Mcdougal Larson Pre-algebra: Student Edition…
Algebra
ISBN:
9780547587776
Author:
HOLT MCDOUGAL
Publisher:
HOLT MCDOUGAL
College Algebra (MindTap Course List)
Algebra
ISBN:
9781305652231
Author:
R. David Gustafson, Jeff Hughes
Publisher:
Cengage Learning